- Option Income Project
- Posts
- The Jobs Report That Could Erase 900,000 Positions Drops Today | SPX Market Briefing | 11 Feb 2026
The Jobs Report That Could Erase 900,000 Positions Drops Today | SPX Market Briefing | 11 Feb 2026
VIX Creeping Higher With Higher Highs And Higher Lows – The Slow Burning Clue We Are All Missing?
T2 Markets
February 11, 2026
Well yesterday’s intraday moves were a sloppy hot mess. But given that the day turned out to be what looks like an exhaustion bar ahead of the delayed NFP release? Not surprising.
I’m still thinking buy the rumor – last week’s rally – sell the news – later today.
The swings? Still bearish. Despite what the system is officially saying. SPX technically is flat having been whipped around. V-entries at the upper range will keep me bearish.
For the eagle-eyed amongst you – I commented on a 5-minute chart yesterday whilst writing something for my insiders. That range can also be used and I’ve highlighted it on the correct 30-minute charts for the day.
MACD-v has also flipped from bullish extreme back to bear. And that range I mentioned technically has already had the breakout pullback. So staying bearish. A new high will reassess for bullish. That may be tomorrow’s or next week’s problem as I plan to again take Friday off this week for some travelling.
RUT is once again the easier read. MACD-v exhausted at the upper range boundary and the TnT system has flipped to bearish. Easy peasy. In line with my bias so I won’t belabor it.
The overall market on the indexes looking at the SnapView? Shitty AF. Nasdaq barely caught an uptick on this recent move and is also starting to roll over. Its 90% correlated brother BTC is starting its dead cat bounce completion. Gravity is reclaiming the cat’s bounce. Back to $60K again.
Gold has clipped the apex of the V I mentioned earlier in the week. A retest of the recent highs seems likely. I may look at GLD for some options.
And VIX. Creeping higher with higher highs and higher lows. Is that the slow burning clue we are all missing?
Be the bear!
Premium Poppers gave me a mixed bag of nuts yesterday. 1 SPX loss. 1 RUT win. Standard stuff. No report card yet because I’ve been lazy.
Onwards to the open. Post-NFP could be fun. Let’s see what we see when we see it. PopPop.
Keep scrolling for the NFP nuke, bearish flip, and the slow burning VIX clue…
900,000 Jobs May Vanish. MACD-v Flips Bear. VIX Creeps Higher. Be The Bear.

One Chart. One Setup. Daily SPX Income Locked In.
No indicators. No guesswork. Just pulse bar profits on repeat.
Market Briefing:
Wednesday 11 Feb. Delayed January NFP drops at 8:30 AM. Benchmark revisions could erase 600K-900K previously reported jobs.
Dow hit a fourth consecutive record at 50,188. But SPX fell 0.33% and Nasdaq dropped 0.59%. The divergence deepens.
SPX technically flat after exhaustion bar. MACD-v flipped from bullish extreme back to bear. V-entries at upper range. Staying bearish.
RUT TnT flipped bearish below 2,689. VIX creeping higher with HH/HL. Gold clips V apex. Bitcoin dead cat bounce completing.
10-year at one-month low 3.93%. Dollar at month-low. Three Fed cuts now priced up from two last week.
Current Multi-Market Status:
ES: 6,960.75 (NATHs 7,043) – rolling over from recent push
YM: 50,325 (NATHs 50,263) – still grinding at all-time highs
NQ: 25,181.00 (NATHs 26,399) – barely caught an uptick, rolling over
RTY: 2,690.7 (NATHs 2,749.2) – TnT flipped bearish
GC: 5,121.2 (NATHs 5,626.8) – V apex clipped, eyes on retest
CL: 64.83 – Iran tensions vs inventory build
VIX: 18.22 – creeping higher, HH/HL pattern developing
BTC/USD: 68,098.64 (was 93,161) – dead cat bounce gravity reclaiming
NYSE Advance-Decline: +617,000 (positive but soft)

SPX Tag ‘n Turn – Flat After Exhaustion Bar
Tag ‘n Turn Status:

SPX was a sloppy hot mess yesterday. Whipsawed around in what turned out to be an exhaustion bar ahead of the delayed NFP.
The system has gone flat. Awaiting fresh setup. But that doesn’t change my bias.
V-entries at the upper range keep me bearish. The 30-minute chart shows price got up to the “@ Upper Range” zone and rolled over. Bearish TnT tagged at the highs. PFZ Flip confirmed.
MACD-v has flipped from bullish extreme back to bear. That’s the confirmation I was looking for. The range I mentioned has technically already had its breakout pullback.
“Target Range Lows” is annotated on the chart. That’s where I’m looking. Price currently at 6,941.82 on the daily with NATHs at 7,002.28 above. ATR 14 at 70.42.
A new high would reassess for bullish. But that may be tomorrow’s or next week’s problem. Friday off for travelling.

RUT Tag ‘n Turn – Flipped Bearish. Easy Peasy.
Tag ‘n Turn Status:
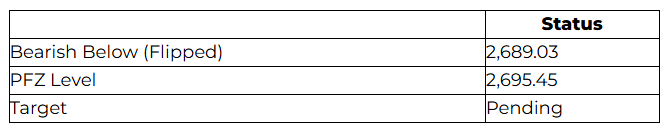
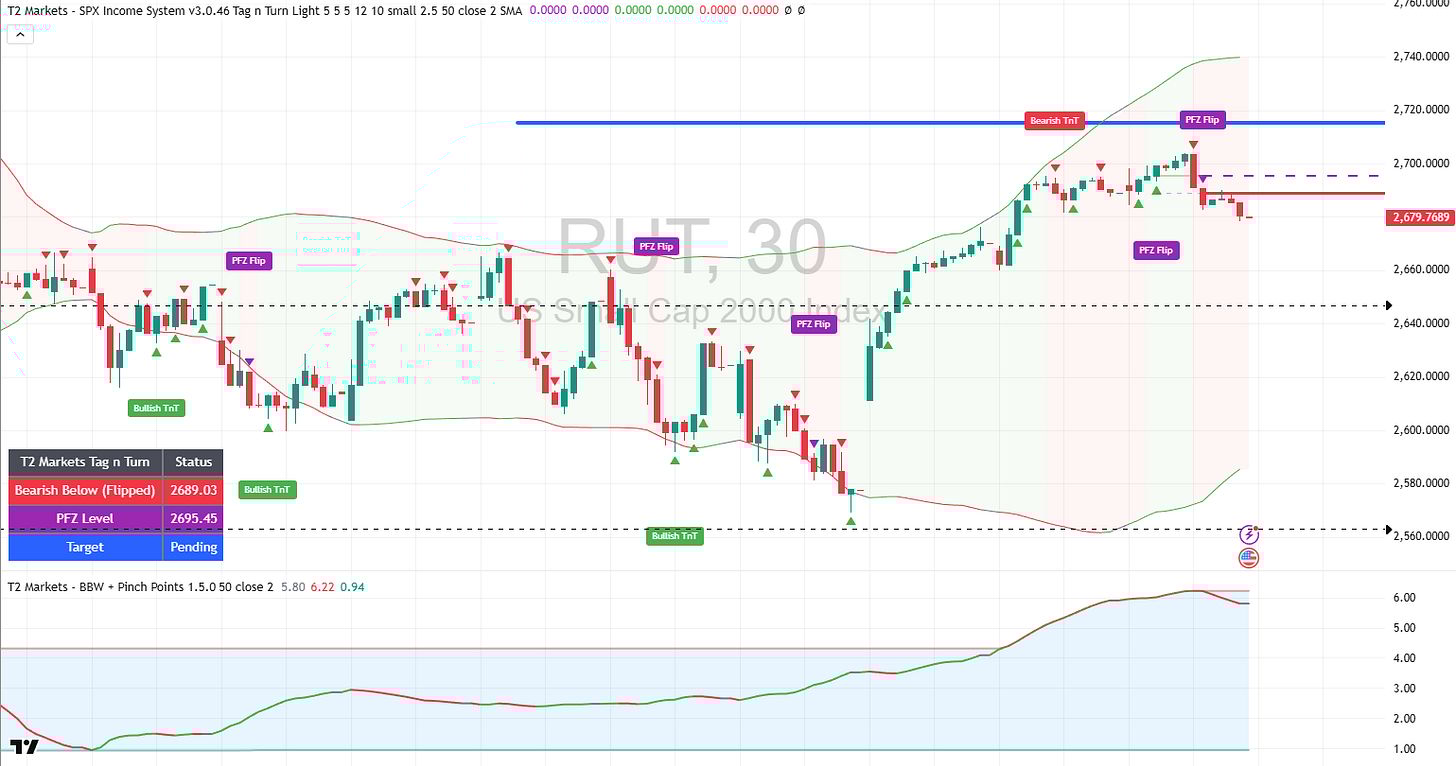
RUT is once again the easier read. TnT system has flipped to bearish below 2,689.03.
MACD-v exhausted at the upper range boundary. The Bearish TnT tag is active on the 30-minute. PFZ Flips visible on the decline from the highs.
In line with my bias so I won’t belabor it. Bearish @ Upper Range zone is marked. The head and shoulders pattern we’ve been tracking is still in play.
Price at 2,679.77 on the daily. NATHs up at 2,735.10. The target is pending but we know the measured move sits down at the 2,564 area from last week’s analysis.
The NFP Bomb – 8:30 AM
January payrolls finally drop today. Delayed five days by the government shutdown.
Consensus expects 55,000-68,000 new jobs. ADP showed only 22,000. White House managing expectations down hard.
But the headline number is secondary. The real story is benchmark revisions. These could erase 600,000 to 900,000 previously reported jobs. Every month of 2025 revised downward. Average monthly gains may shrink below 40,000.
That’s not a revision. That’s a confession. Two years of “resilient labor market” narrative potentially unravelling in one release.
Rate traders are pricing three Fed cuts now up from two last week. The 10-year sitting at a one-month low of 3.93% tells you the bond market already suspects what’s coming.
Buy the rumor. Sell the news.
The Slow Burning VIX Clue
VIX at 18.22 and creeping higher. Higher highs and higher lows forming a steady staircase pattern.
Everyone’s focused on the headline index moves. But VIX quietly building a base with a bullish pattern is the kind of thing that catches the crowd off guard.
Is this the slow burning clue we are all missing? A VIX climbing whilst markets grind sideways usually resolves with a sharp move lower in equities.
Combined with MACD-v flipping bear on both SPX and RUT, and the NFP bomb about to drop? The pieces are lining up.
Bitcoin – Gravity Reclaims The Cat
BTC at $68,098. Down from the $93,161 October record. Lost $70,000 support yesterday, hitting $67,539.
The dead cat bounce is completing. Gravity is reclaiming the cat’s bounce. Back to $60K looks increasingly likely.
Fear & Greed Index still at extreme fear levels. ETF flows reversed with institutions now net sellers. Stablecoin talks stalled. Mike Novogratz declared speculation’s era over.
Meanwhile gold clipped $5,121 and the V apex I mentioned earlier in the week. A retest of the recent highs seems likely. I may look at GLD for some options on the continued physical over digital rotation.
Earnings Snapshot
Tuesday’s mixed bag:
Spotify crushed it: 4.43 euro EPS vs 2.74 estimate. Stock +17%
Datadog surged 16% on 29% revenue growth. AI observability demand validated
S&P Global crashed 10% on AI disruption fears. Guided below Street
Mattel collapsed 24%. Ouch
Coca-Cola missed revenue. Down 4%. Defensive thesis dented
Coming up: Ford and Gilead tonight. Thursday: Airbnb, Coinbase, Moderna.
Yesterday gave me a mixed bag.
1 SPX loss. 1 RUT win. Standard stuff. Net flat for the day.
No report card yet because I’ve been lazy. That’s my confession for the day. But the running stats don’t change off one mixed session.
The beauty of systematic trading? One mixed day doesn’t derail the process. You place the next trade regardless. That’s the whole point.
Post-NFP could deliver some tasty Popper setups. Let’s see what we see when we see it.
PopPop.
AI-BotView

1. Benchmark revisions of this magnitude have happened twice in the last 25 years. In March 2019, the BLS revised 2018 non-farm payrolls down by 501,000 jobs. Markets initially sold off but recovered within two weeks as the revision was treated as “old news.” In February 2024, preliminary benchmark estimates suggested an 818,000 downward revision for the 12 months through March 2024. Today’s potential 600K-900K revision would be the largest since post-pandemic recalibrations. The market’s reaction depends entirely on whether traders treat it as historical housekeeping or forward-looking signal. [Source: BLS benchmark revision archives]
2. The Dow-Nasdaq divergence now exceeds 12 percentage points on a trailing 30-day basis. Dow records four sessions running whilst Nasdaq sits -10% from NATHs. In the last 50 years, a divergence of this magnitude has resolved within 45 trading days in 6 of 8 instances. In 4 of those 6, resolution came via the laggard catching up. In 2 of those 6, the leader came down. Current software massacre dynamics (IGV -24% YTD) suggest the Nasdaq catch-up scenario faces structural headwinds that previous divergences did not.
3. VIX building a base with higher highs and higher lows whilst equity indices grind sideways is a pattern worth noting. Since 2010, VIX has formed a 10-day staircase pattern (consecutive HH/HL) on 23 occasions. In 17 of those 23, the S&P 500 declined more than 2% within the following 15 trading days. The current staircase starting from VIX 15.5 suggests implied volatility is being repriced ahead of a catalyst. NFP benchmark revisions and Friday’s CPI represent back-to-back potential triggers.
In Other News…
Dow Posts Fourth Straight Record; Everything Else Falls Apart
Blue chips thrive on industrial strength whilst software, retail, and fizzy drinks simultaneously combust.
Wall Street’s great divergence widened Tuesday as the Dow notched its fourth consecutive record whilst the S&P and Nasdaq declined. The industrial average’s old-economy tilt keeps winning whilst technology, retail, and even Coca-Cola—yesterday’s defensive darling—simultaneously disappointed. Jobs data arrives at 8:30 AM to potentially ruin everyone’s morning.
The Industrial Island
Dow 50,188, another record, whilst S&P fell 0.33% and Nasdaq dropped 0.59%. The index stuffed with caterpillars, planes, and pharmaceuticals thrives precisely because it lacks the AI capex anxiety plaguing everything else. Four straight records built on things that move, dig, and heal—not things that compute.
The Consumer Cracks
December retail sales printed flat versus +0.4% expected. Costco -3%, Walmart -2%. Coca-Cola dropped 4% on revenue miss, proving yesterday’s “defensive rotation” thesis had a 24-hour lifespan. Mattel collapsed 24% because apparently nobody bought enough toys. Consumer spending—the backbone of the economy—wobbling into jobs day.
The Software Paradox
Spotify crushed earnings, up 17%. Datadog surged 16% on 29% revenue growth. Yet the software index sits -24% YTD and S&P Global crashed 10% on guidance miss, dragging Moody’s -6.8% in sympathy. Some software thrives; most software dies. Distinguishing which is which remains the 2026 stock-picking challenge.
Expert Insights:
Exhaustion bars ahead of major data releases are the market’s way of saying “we don’t know what to do with ourselves.” The price action looks messy. Traders get whipsawed. The charts look like a toddler drew them.
But that’s actually useful information.
When the market exhausts itself at a range boundary and MACD-v flips from bullish extreme back to bear? That’s the setup. Not the prediction. The setup.
The system going flat on SPX isn’t a failure. It’s patience. Flat means “I don’t have edge right now, so I’m not going to pretend I do.” The fresh setup will come.
Meanwhile RUT cooperates beautifully. TnT flips bearish. MACD-v exhausted. System and bias aligned.
The lesson is not every instrument gives you a clean read every day. That’s why you trade multiple setups across multiple instruments. SPX is messy? Fine. RUT is clean. Poppers are working. The system finds the edge where it exists.
Fun Fact:
The Bureau of Labor Statistics benchmark revision process has been conducted annually since 1979.
The single largest downward revision in history occurred in February 2010, when the BLS erased 930,000 jobs from the 2009 data – confirming the Great Recession was significantly worse than real-time data had suggested.
Traders who positioned ahead of that revision based on leading indicators like the JOLTS survey and weekly claims data captured the subsequent 4.2% S&P 500 decline. Today’s potential 600K-900K revision would rank as the second or third largest in the 47-year history of the process.
[Source: Bureau of Labor Statistics, Historical Benchmark Revision Records]
Trade well,
T2 Markets
p.s. Want full access to the SPX Income System (includes 7+ mechanical income strategies)? Join our team now!
p.p.s. Want funding to DAY TRADE our options strategies? Discover how you can start trading with up to $250k of RISK FREE capital!
Reply