- Option Income Project
- Posts
- Schizophrenic Markets Gap Down Then Rally All Day. RUT Says Nope. | SPX Market Briefing | 27 Jan 2026
Schizophrenic Markets Gap Down Then Rally All Day. RUT Says Nope. | SPX Market Briefing | 27 Jan 2026
Nasdaq Throws Hissy Fit. Attempts Breakout. Bitcoin Still Asleep.
T2 Markets
January 27, 2026
What a bloody ride.
Gold up then down. Indexes gap lower then climb all night. Then climb all day. Except Uncle Russell, who looked at all that bullish enthusiasm and said “nah, I’m good down here.”
Meanwhile Nasdaq’s throwing a hissy fit because it’s been missing all the moves. Now it’s attempting another breakout whilst every bro’s favorite store of wealth – Bitcoin – remains fast asleep on the sofa.
The indexes aren’t just divergent anymore. They’re schizophrenic. Up one day, down the next, each doing their own thing with zero regard for what the others are doing.
The old normal was correlation. The new normal is chaos.
But here’s the thing that matters: the bigger picture consolidations are still holding. Nothing new is developing. And until something actually breaks, the same thing is likely to keep happening.
Which means more of this. Joy.
Scroll down for the systematic breakdown – including why flat is still the smartest position on the board…

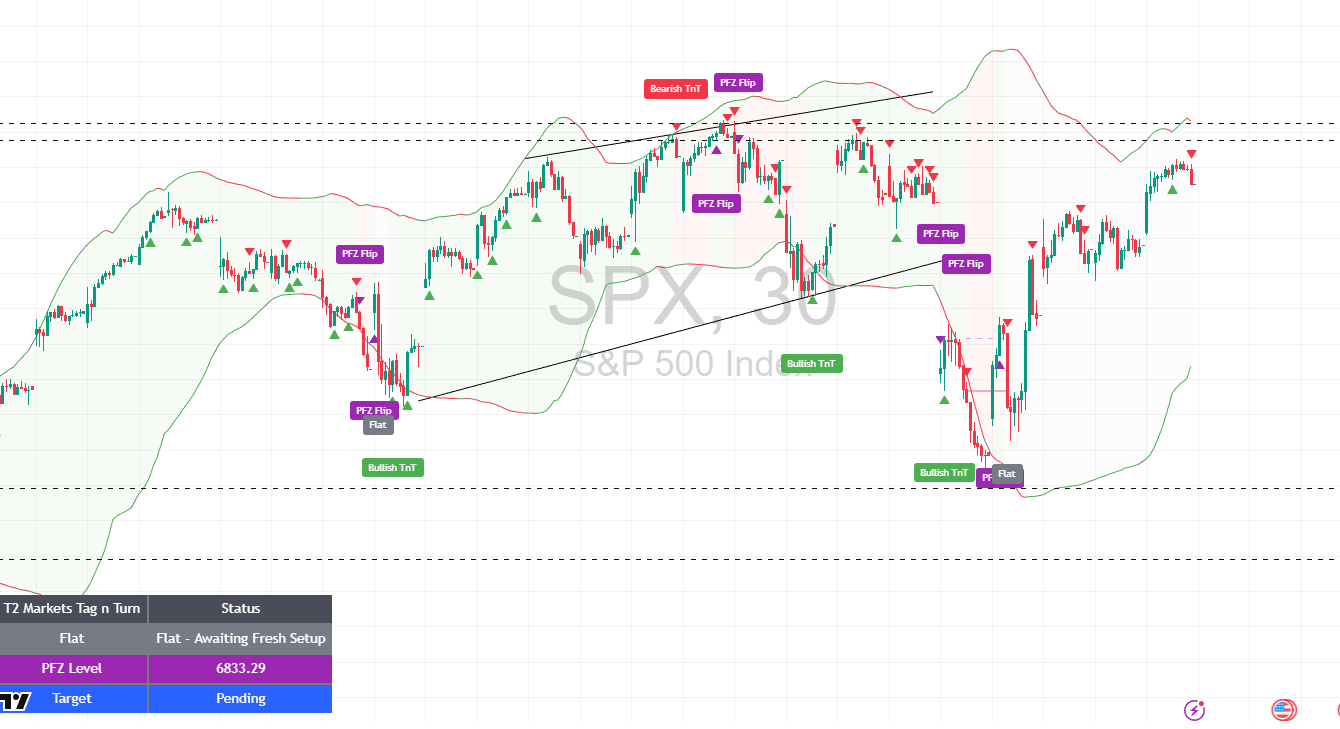
SPX. 30 Minutes. One Trade. Job Done.
Trade less. Profit more. This isn’t trading… it’s income engineering.
Market Briefing:
Multi-Market Status
SPX: Flat – Awaiting Fresh Setup. PFZ Level 6833.79. Target pending. Price holding the rising VWAP for those still discretionary bullish. Once again approaching new all-time high territory. The system says wait. The price action says “maybe.” We wait.
RUT: Bearish Below 2727.88. PFZ Level 2735.1. Target 2632.36. Bear mode firmly activated but momentum has exhausted for the moment. Price resting on the outside of the upper rising channel we noted last week. Make or break time. Again.
ES Futures: 6,998.25 – back above the gap, testing highs. Climbed all night, climbed all day.
NQ Futures: 25,999.50 – the hissy fit index. Attempting another breakout because it’s been left out of too many moves. Whether this one sticks is another question entirely.
YM Futures: 49,514 – following along, nothing special to report.
RTY Futures: 2,679.4 – the holdout. Pushed back lower whilst everyone else rallied. Held cash session lows. Classic Russell stubbornness.
Gold: Up then down. Not back up overnight. Taking a breather after the $5,000 excitement.
VIX: 16.00 – steady, unbothered, watching the chaos unfold.
Bitcoin: $87,658 – still asleep. Bros waiting. And waiting. And waiting.

The Schizophrenic Market Condition
Let’s be honest about what’s happening here:
Monday: Gap lower. Rally all day. Last Week: Rally. Then reverse. Then rally. Then reverse. The Week Before: Same thing.
Each index is doing its own thing. SPX rallies whilst RUT drops. Nasdaq attempts breakouts whilst Dow consolidates. There’s no leadership, no clear direction, no correlation.
This is the new normal. At least until something breaks the bigger picture ranges.
What’s holding:
SPX still within its rising channel
RUT still within its larger consolidation (now testing the upper channel from outside)
NQ still within its range despite the breakout attempts
Gold still elevated but consolidating after $5,000
What would change things:
SPX breaking above NATHs with conviction
RUT breaking below 2632 target zone
NQ actually following through on a breakout
Any of the bigger consolidation structures failing
Until then? Same thing. Different day.
The RUT Make or Break Zone
Uncle Russell deserves special attention today.
Whilst everyone else was rallying, RUT pushed back lower and held the cash session lows. The bear momentum that drove last week’s decline has exhausted for now, but price is resting right on the outside of that upper rising channel.
Two scenarios from here:
Scenario A – Break Back In: Price pushes back above the channel, negates the bearish structure, heads back towards ATHs. Bear TnT gets invalidated.
Scenario B – Reject and Continue: Price uses the channel as resistance, bounces lower, continues towards the 2632 target. Bear TnT plays out.
We don’t predict. We wait and see which scenario develops. The system already has us positioned bearish below 2727.88. The market will tell us if that’s right or wrong.

Whilst the indexes played their schizophrenic games, the Poppers kept doing their job:
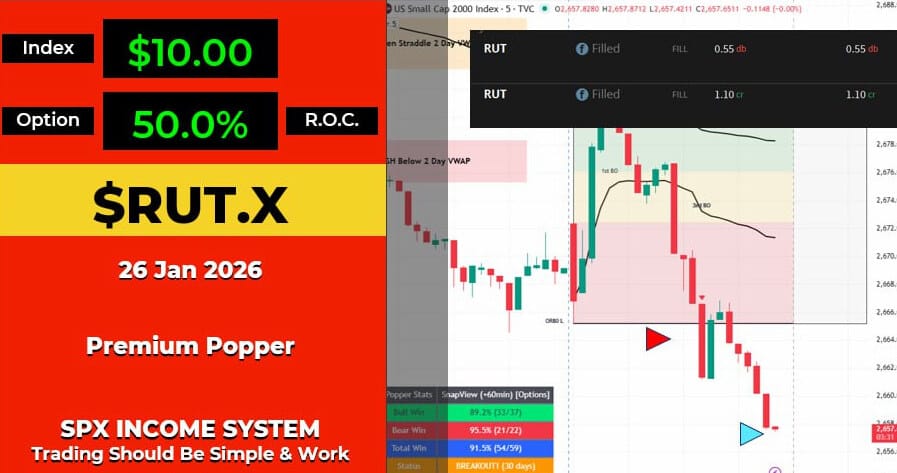
RUT Premium Popper #1: 50% ROC on a $10 index move. Classic first breakout setup.
RUT Premium Popper #2: 69.9% ROC on a $4 index move. Bearish below 2-day VWAP entry.
Other community members pulled both RUT and SPX scalps throughout the session.
Popper Stats (30-day rolling):
Bull Win: 89.2% (33/37)
Bear Win: 95.5% (21/22)
Total Win: 91.5% (54/59)
When the indexes can’t make up their minds, systematic scalping keeps traders sane. Profits don’t care about market direction.
Pop Pop.

The Week Ahead (Economic Calendar)
Wednesday 28 Jan:
2:00pm – Federal Funds Rate (Forecast: 3.75%, Previous: 3.75%)
FOMC Statement
2:30pm – FOMC Press Conference
Tesla, Microsoft earnings
Thursday 29 Jan:
8:30am – Unemployment Claims (Forecast: 206K, Previous: 200K)
Meta, Apple earnings
Friday 30 Jan:
8:30am – Core PPI m/m (Forecast: 0.2%, Previous: 0.0%)
8:30am – PPI m/m (Forecast: 0.2%, Previous: 0.2%)
Fed expected to hold. But it’s the language that matters. Any shift in tone with this market volatility could create fireworks.
Expert Insights
The Divergence Dilemma
When major indexes stop moving together, it typically signals one of two things: either a rotation is underway between sectors/styles, or the market is searching for direction without conviction.
The current divergence – RUT weakness whilst SPX/NQ attempt new highs – suggests large caps are being supported whilst small caps face selling pressure. This often precedes broader market weakness, as small caps tend to lead both rallies and declines.
However, divergence can persist for weeks before resolving. The key isn’t predicting which way it resolves, but ensuring your systematic approach works regardless of direction.
That’s why scalping strategies like Premium Poppers thrive in these conditions – they profit from volatility itself rather than requiring directional conviction.
[Source: Market structure observation – index correlation analysis]
Fun Fact:
Market Correlation and Its Discontents
The average correlation between S&P 500, Nasdaq, and Russell 2000 over the past decade has been approximately 0.85. During the current January period, that correlation has dropped to approximately 0.62 – a significant divergence from historical norms.
Extended periods of low inter-index correlation typically resolve in one of two ways: either all indexes converge on a new direction (often the direction the “leader” was heading), or the divergence signals broader market stress that eventually triggers correlated selling.
The last time we saw similar divergence levels was late 2018, just before the December selloff brought everything back into (downward) correlation.
[Source: Index correlation analysis – historical market data]
Trade well,
T2 Markets
p.s. Want full access to the SPX Income System (includes 7+ mechanical income strategies)? Join our team now!
p.p.s. Want funding to DAY TRADE our options strategies? Discover how you can start trading with up to $250k of RISK FREE capital!
Reply