- Option Income Project
- Posts
- October Arrives Right On Schedule. Markets Remain Undecided. | SPX Market Briefing | 30 Sep 2025
October Arrives Right On Schedule. Markets Remain Undecided. | SPX Market Briefing | 30 Sep 2025
Tag ‘n Turn Grinds Theta While Custom Tools Signal Neutral Territory
T2 Markets
September 30, 2025
Morning traders – it’s Tuesday, last day of the month, and boredom may well kick in on these indices as the bean counters juggle positions for month-end reporting. The systematic approach handles this admirably by simply continuing to collect theta regardless of market enthusiasm levels.
On SPX, history appears to be repeating itself with those orange and blue circles marking similar pattern behavior. The big question for me: will we see new all-time highs, or is this the short-term top? Given we’re in crash/correction season, I’m favoring a short-term top for now.
That doesn’t mean we can’t see, for example, a December sell-off later – it’s just that these moves commonly appear at certain predictable times of the year, every year. The beauty of systematic trading lies in responding to what actually happens rather than becoming married to seasonal predictions.
Keep scrolling for the crude oil three-win streak…

SPX Market Briefing:
Tuesday’s last day of month positioning creates the sort of indecisive price action that systematic approaches handle brilliantly through patience.
Current Multi-Market Status:
SPX: Historical pattern repeating, awaiting directional clarity on highs vs top
Tag ‘n Turn: Upper BB tag complete, awaiting bear pulse bar confirmation
RUT: More pronounced pattern offering clearer systematic read
Futures: ES and RTY pinching between A.VWAP lines suggesting neutral territory
Historical Pattern Recognition:
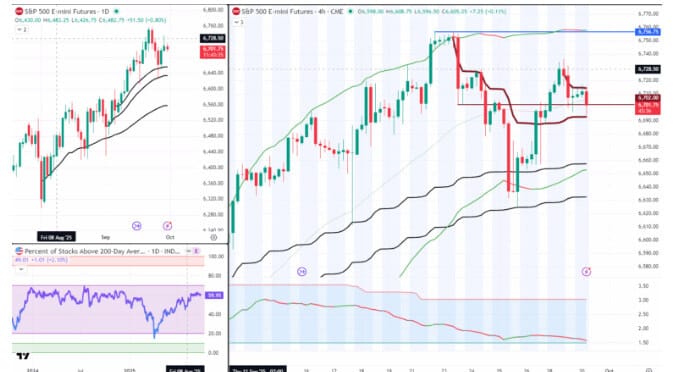
Looking at SPX’s daily chart (top left), we can see history repeating itself with the orange and blue circled areas. These similar patterns at key junctures raise the essential question: new all-time highs or short-term top?
My bias leans towards short-term top given the crash/correction season timing, but systematic discipline requires waiting for actual confirmation rather than acting on seasonal expectations alone. Custom tools I’m experimenting with also suggest neutral movements for the moment.
Tag ‘n Turn Daily Grind:
The Tag ‘n Turn – our daily theta collection machine – does its thing as always. We’ve tagged the upper Bollinger Band and now simply await the bear pulse bar to confirm directional intent.
Given it’s the last day of the month and this week’s news flow, the neutral positioning isn’t particularly surprising. Most market participants count beans whilst awaiting Friday’s big employment data release.
RUT Clarity Advantage:
RUT looks very similar to SPX but more pronounced, offering a considerably easier read for systematic positioning. When two indices show correlation but one provides clearer signals, that’s valuable information for mechanical execution.
Futures Pinching Analysis:
ES and RTY futures’ bigger picture hasn’t changed dramatically. I’m still leaning bearish here, though RTY’s 4-hour bear A.VWAP line has been reclaimed and we’re clearly “pinching” between the bull and bear A.VWAP boundaries.
Same analysis, different timeframes and instruments, although same underlying market. Bottom line? Meh. Perfectly acceptable systematic response to unclear conditions.
Crude Oil Three-Win Streak:
/CL crude oil futures – you slick sip of Texas tea – delivered pretty much as expected. Bearish on a range reversal producing another pop ‘n drop. I wish they all moved this quickly.
We’re now 3 for 3 since including it in the trading rotation, currently targeting the range lows as standard per the 6 Money Making Patterns. When systematic approaches work this consistently across new instruments, it validates the mechanical framework beautifully.
Bottom Line Summary:
Swings are swinging
Theta is dripping
Poppers are popping (as soon as the opening bell rings)
This Week’s Calendar Context:
Employment data week means Friday’s Non-Farm Payrolls takes center stage whilst Tuesday-Thursday provide the appetizers. Month-end positioning adds another layer of participant behavior to navigate through systematic patience.


Fun Fact:
Flash Crashes: When Markets Have Seizures
Flash crashes see markets drop 5-10% in minutes before recovering just as quickly-like financial epilepsy where billions of dollars vanish and reappear faster than you can refresh your browser!
Flash crashes are what happen when the stock market has a full-scale technological seizure and decides to simulate the apocalypse in fast-forward!
The most famous occurred on May 6, 2010, when the Dow Jones dropped nearly 1,000 points in minutes due to a single $4.1 billion sell order that sent algorithms into a panic-induced feeding frenzy faster than piranhas spotting a wounded tourist.
These crashes happen so quickly that by the time you notice your portfolio has lost 20%, it’s already back to where it started, leaving you wondering if you imagined the whole thing or just witnessed the financial equivalent of a glitch in the Matrix.
High-frequency trading algorithms, programmed with about as much emotional intelligence as a hyperactive calculator, react to price movements by generating more price movements, creating feedback loops that make a amplifier’s feedback sound like a lullaby.
Some stocks trade for literally pennies during flash crashes while others spike to ridiculous heights, creating a brief alternate reality where Apple might be worth 50 cents and some penny stock becomes temporarily more valuable than GDP of small countries.
The best part is that these crashes often happen during lunch breaks when most humans aren’t even watching, so computers basically have nervous breakdowns and recover without adult supervision.
It’s proof that artificial intelligence can have panic attacks just as spectacular as human intelligence, except they happen at the speed of light and resolve themselves before most people can even panic properly!

Trade well,
T2 Markets
p.s. Want funding to DAY TRADE our options strategies? Discover how you can start trading with up to $250k of RISK FREE capital!
Reply