- Option Income Project
- Posts
- NATO Burns, Futures Crash, Greenland Changes Everything – Range Highs to Lows Validated | SPX Market Briefing | 20 Jan 2026
NATO Burns, Futures Crash, Greenland Changes Everything – Range Highs to Lows Validated | SPX Market Briefing | 20 Jan 2026
Trump’s 10% Tariff Bomb on Eight Allies Triggers Worst Pre-Market Since October
T2 Markets
January 20, 2026
Just when you think a long holiday weekend would be quiet – we go and get the Greenland Edition of Tariff Wars.
S&P futures down 1.7% at 6,857. Nasdaq off 2.1%. Dow futures dropped 813 points overnight.
The catalyst? Saturday’s Truth Social bombshell. Trump announced 10% tariffs on Denmark, Norway, Sweden, France, Germany, UK, Netherlands, and Finland starting February 1st. Rising to 25% by June 1st unless… Greenland is sold. Eight NATO allies. $236 billion in German trade alone. EU already planning $108 billion in retaliation.
Keep scrolling – the charts saw this coming even if the news didn’t…
Range Highs Called It. System Delivered.

SPX Doesn’t Need You To Be Right. Just Consistent.
Pulse bar tells you when. Credit spreads handle the rest.
Market Briefing:
The Dark Room Trading Advantage
Last week, we talked about price on the main indexes being up at range highs.
Said we should see a move down to range lows.
And what happened? A few false starts – the brief bullish Tag ‘n Turn that I avoided entirely because I was physically incapable of staring at screens.
Sometimes the best trade is the one you don’t take.
Our discretionary bias stayed bearish on both SPX and RUT throughout.
Not because I’m some genius who predicted Greenland drama.
Simply because the charts were screaming “range highs” and the 6 Money Making Patterns don’t care about geopolitics.
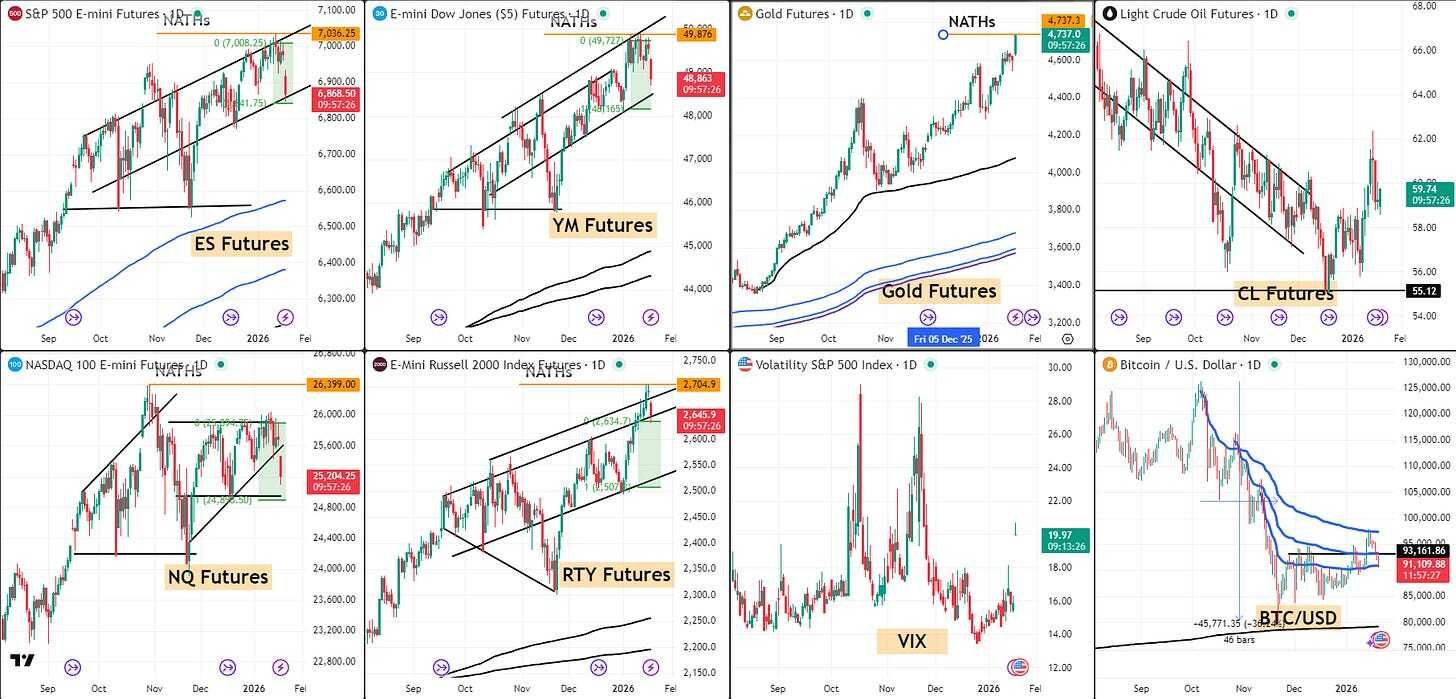
Current Multi-Market Status:
SPX: Bearish bias – Range highs rejection confirmed – Target range lows 6,785
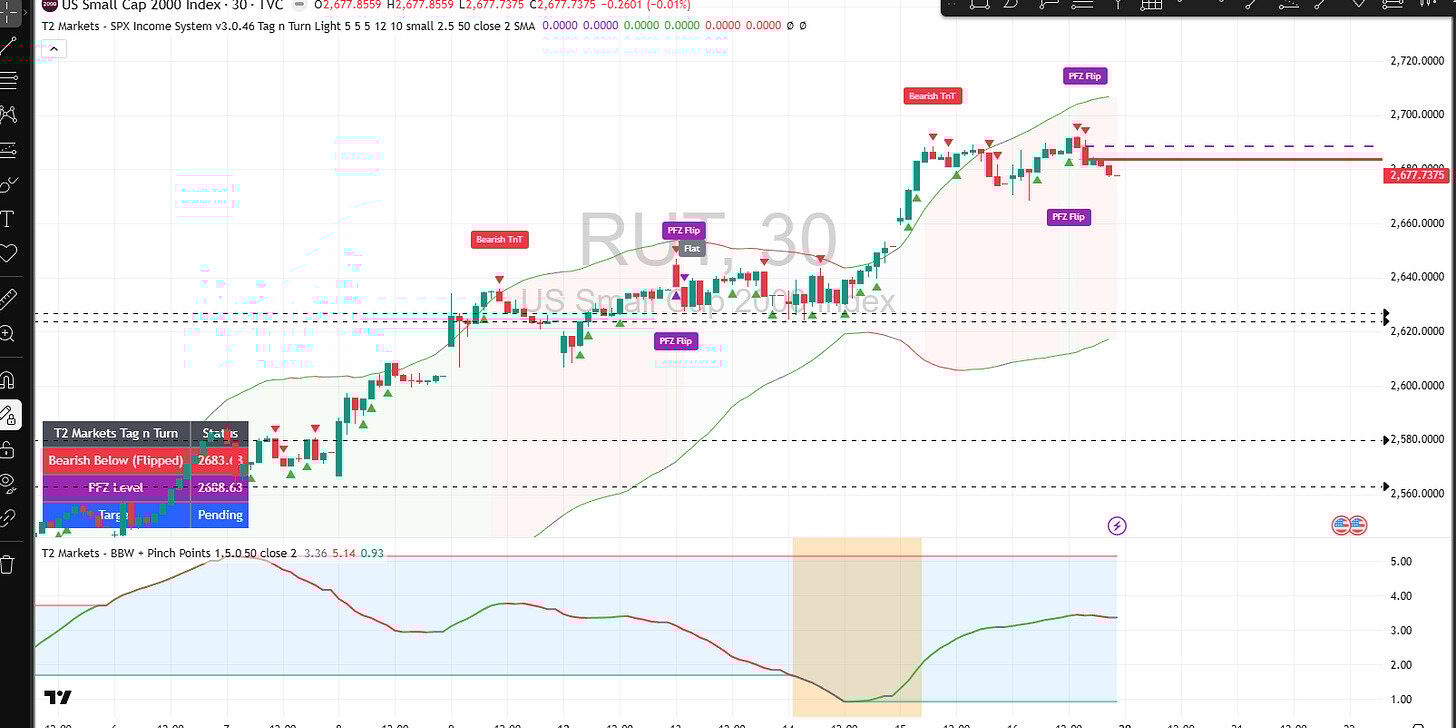
RUT: TnT Bearish Below (Triggered) – Status 2683.68 – PFZ 2688.63 – Target Pending
ES: 6,868.50 – Down from NATHs, gapping lower
RTY: 2,645.9 – Bearish move underway
YM: 48,863 – Following the herd lower
NQ: 25,204.25 – Tech leading the decline
GC: 4,737.3 – Safe haven bid, at NATHs
CL: 59.74 – Holding in downtrend channel
VIX: 19.97 – Fear gauge waking up
BTC: 93,161.86 – Crypto catching some bid
The Supporting Evidence Was There All Along
Beyond the obvious “we’re at range highs” setup from the 6 Money Making Patterns, the charts were providing additional confirmation:
Clear V-shaped entry patterns – The classic reversal signal that doesn’t require a news catalyst to work.
Divergence in price to indicator – On my new toy (soon to be officially integrated into the SPX Income System), we had a clear divergence highlighting reducing momentum to make new highs. Price going up, momentum going down. Classic distribution.
RUT extreme reading – Small caps showed an extreme divergence reading accompanying this setup. When Uncle Russell starts flashing warnings, large caps tend to follow.
This is why systematic beats emotional. The evidence was on the charts before Trump’s weekend social media session.
Targets: Range Highs to Range Lows
The plan is beautifully simple: we came from range highs, we’re heading to range lows.
For SPX, that puts 6,785 area in focus. Current price gapping down nicely from Friday’s close.
Now here’s where it gets interesting. We may see some overshoot as we pass through the range lows and move into a breakout situation. If that happens, I’ll be delaying the bullish Tag ‘n Turns in favor of the larger pattern.
Why catch a falling knife when you can wait for the floor?

The 10% in 10 Days Question
Will this be the corrective move I’ve been banging on about since last September?
The setup is finally here. Range highs rejection. Divergence confirmed. External catalyst provided. VIX waking up from its slumber.
If we do get the extended move through range lows into genuine breakdown territory, this could be the beginning of something more significant than a simple range bounce.
Either way – I’ve got patterns for both scenarios. That’s the beauty of mechanical rules over emotional prediction.
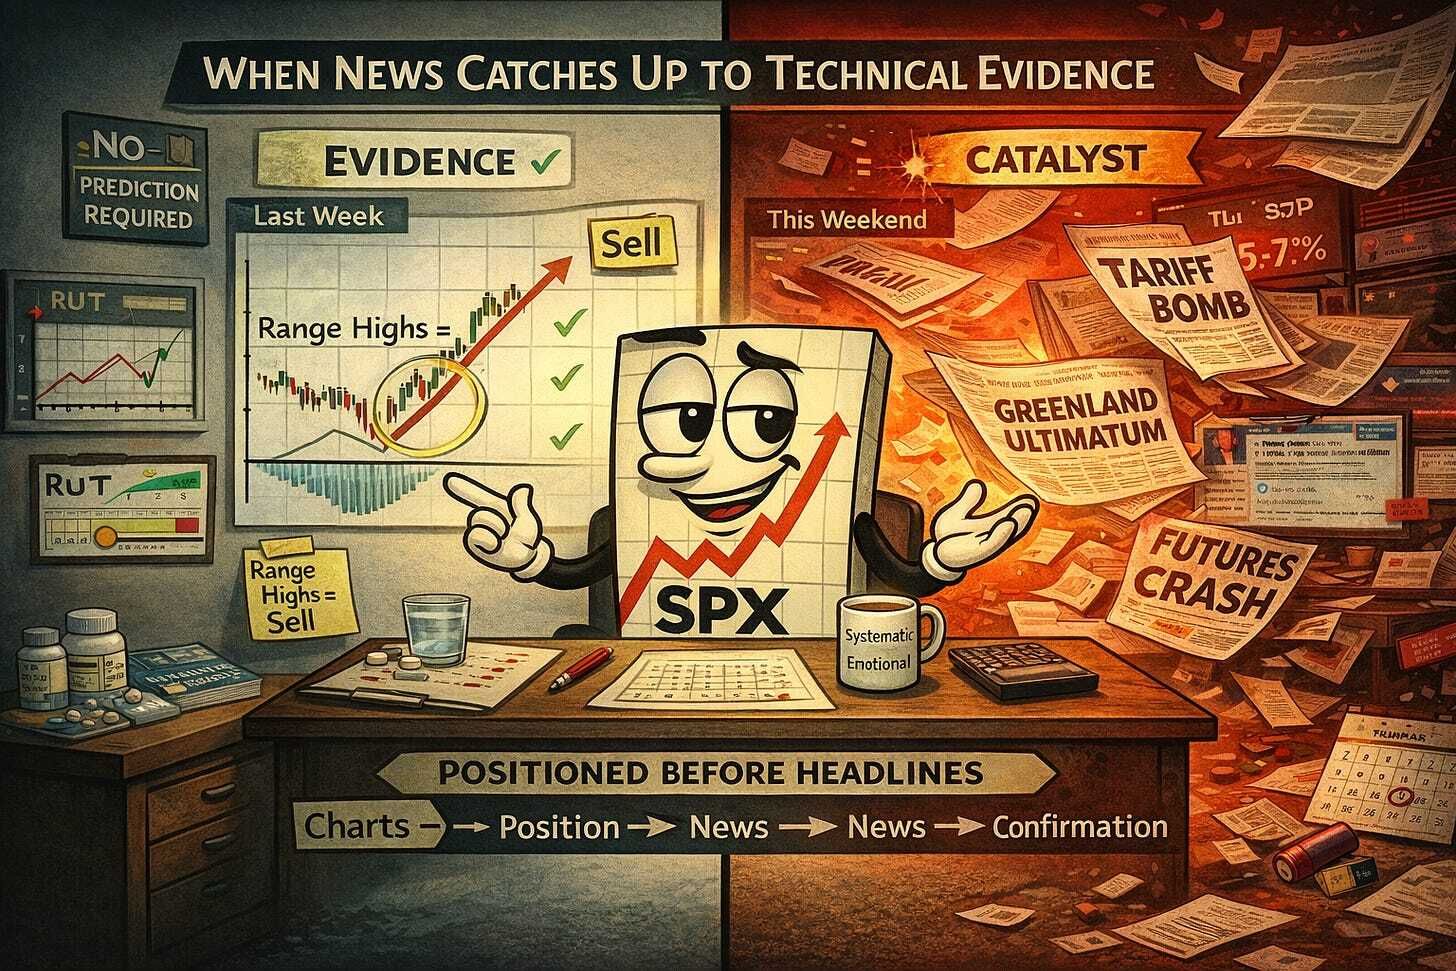
Expert Insights:
When the News Catches Up to the Charts
Every major move has traders who say “I knew it was coming.” Most are lying. Some got lucky. But the systematic traders? They positioned based on the evidence before the catalyst.
Range highs are range highs. Divergence is divergence. Extreme readings are extreme readings. None of these require you to predict geopolitical drama.
Fun Fact:
The January Barometer has correctly predicted the year’s direction 86% of the time since WWII. When the S&P 500 finishes January positive, stocks have averaged 16.2% gains for the full year. With this selloff hitting mid-January, all eyes now turn to whether bulls can recover before month-end to preserve the bullish signal.
[Source: Fidelity – “January Barometer 2025”]
Trade well,
T2 Markets
p.s. Want full access to the SPX Income System (includes 7+ mechanical income strategies)? Join our team now!
p.p.s. Want funding to DAY TRADE our options strategies? Discover how you can start trading with up to $250k of RISK FREE capital!
Reply