- Option Income Project
- Posts
- Monday’s Relief Rally Lasted 18 Hours. Brent Reloaded. Bears Back in Charge. | SPX Market Briefing | 17 Mar 2026
Monday’s Relief Rally Lasted 18 Hours. Brent Reloaded. Bears Back in Charge. | SPX Market Briefing | 17 Mar 2026
To Spike or Not to Spike – A Tariff Rumor, a White House Denial, and a 2% Move in Both Directions
T2 Markets
March 17, 2026
Monday’s relief rally lasted less than 18 hours. All 11 sectors green. Tankers briefly navigating Hormuz over the weekend giving markets something to work with. By Tuesday morning Iran had struck the Shah natural gas field in the UAE, the new Supreme Leader had confirmed the Strait closure “must certainly continue,” and Brent was back above $100.
Nothing has changed in the big picture. The bearish slant remains on everything.
One small note before the analysis – the futures contract rollover is making the overnight continuous charts look a little funky on the main indexes. Nothing to worry about, just worth knowing when you’re looking at the overnight action.
FOMC opens today. Rate hold is certain at 95%+. What matters is Wednesday – the dot plot, Powell’s press conference, updated projections. Core PCE at 3.1%. Oil above $100. Goldman raised recession odds to 25%. Every word Powell says will be dissected.
And yesterday’s late session gave us another reminder that random tweets still create random spikes. More on that below.
Nothing Changed. Bears in Charge. Wednesday is the Pivot.
Market Briefing:
Tuesday 17 Mar. Monday closed Dow +388 at 46,946, S&P +1.1%, Nasdaq +1.2% – all 11 sectors green on light volume as select tankers briefly navigated Hormuz.
That premise evaporated overnight: Iran struck the Shah natural gas field in the UAE, the new Supreme Leader confirmed the Strait closure continues, Brent back above $100. Futures -0.3% S&P, -0.4% Nasdaq, Dow -117 Tuesday morning.
FOMC two-day meeting opens today, hold 95%+ priced, dot plot and Powell Wednesday are the event.
Bitcoin broke $75K overnight – up 13% since Epic Fury began. Goldman raised recession odds to 25%.
Market Snapshot
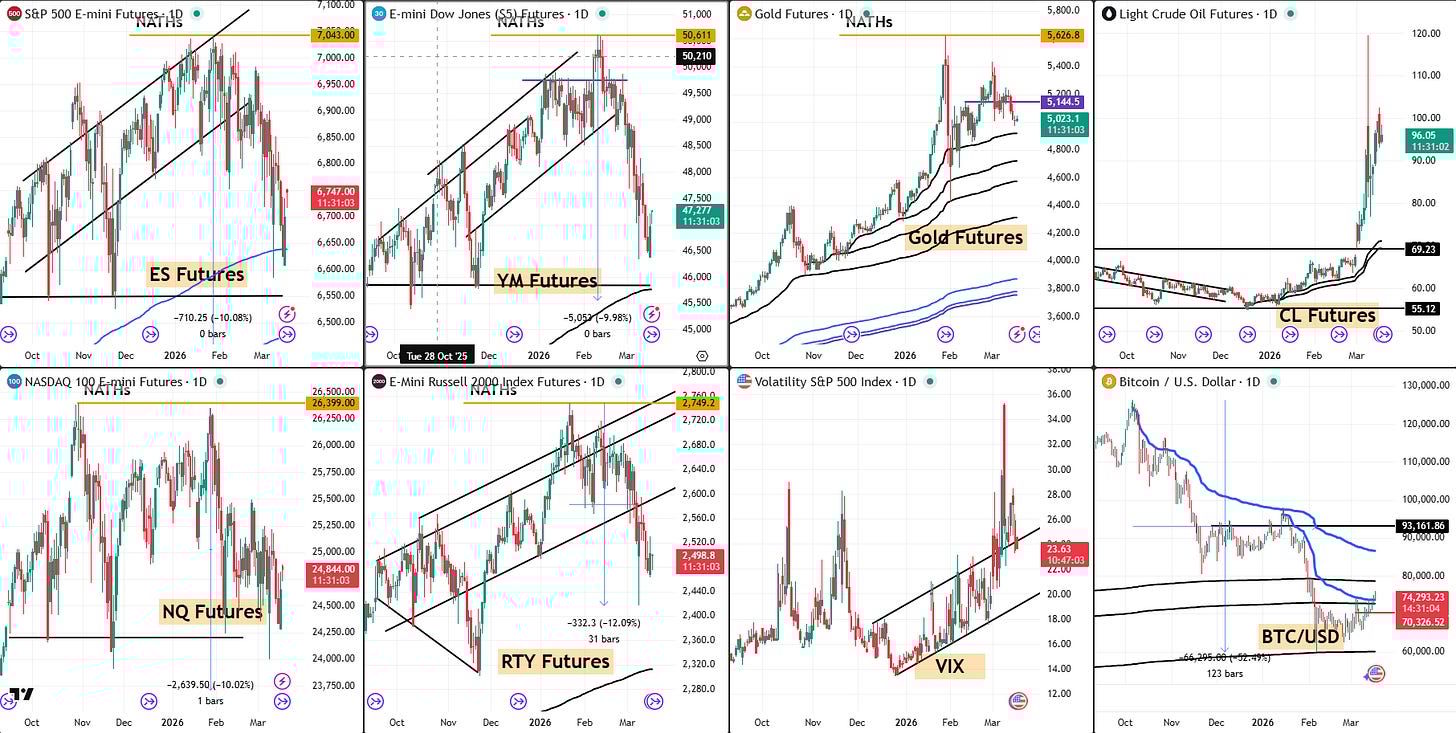
ES: 6,747.00 / futures -0.3% Tuesday morning / Monday’s rally already evaporating
YM: 47,277 / Dow -117 pre-market / Monday’s +388 giving back
NQ: 24,844 / -0.4% Tuesday / Nvidia investor Q&A today 9am PT
RTY: 2,498.8
GC: 5,023.1 / war premium intact / $5,017 Monday
CL: 96.05 / Brent back above $100 / Iran UAE gas field strike overnight
VIX: 23.63 / holding elevated / relief rally didn’t dent it
BTC/USD: 74,293.23 / broke $75K overnight / up 13% since Epic Fury / ETF inflows $1.3B March
Tag ‘n Turn
Both instruments remain bearish and if anything the picture is getting cleaner, not murkier.
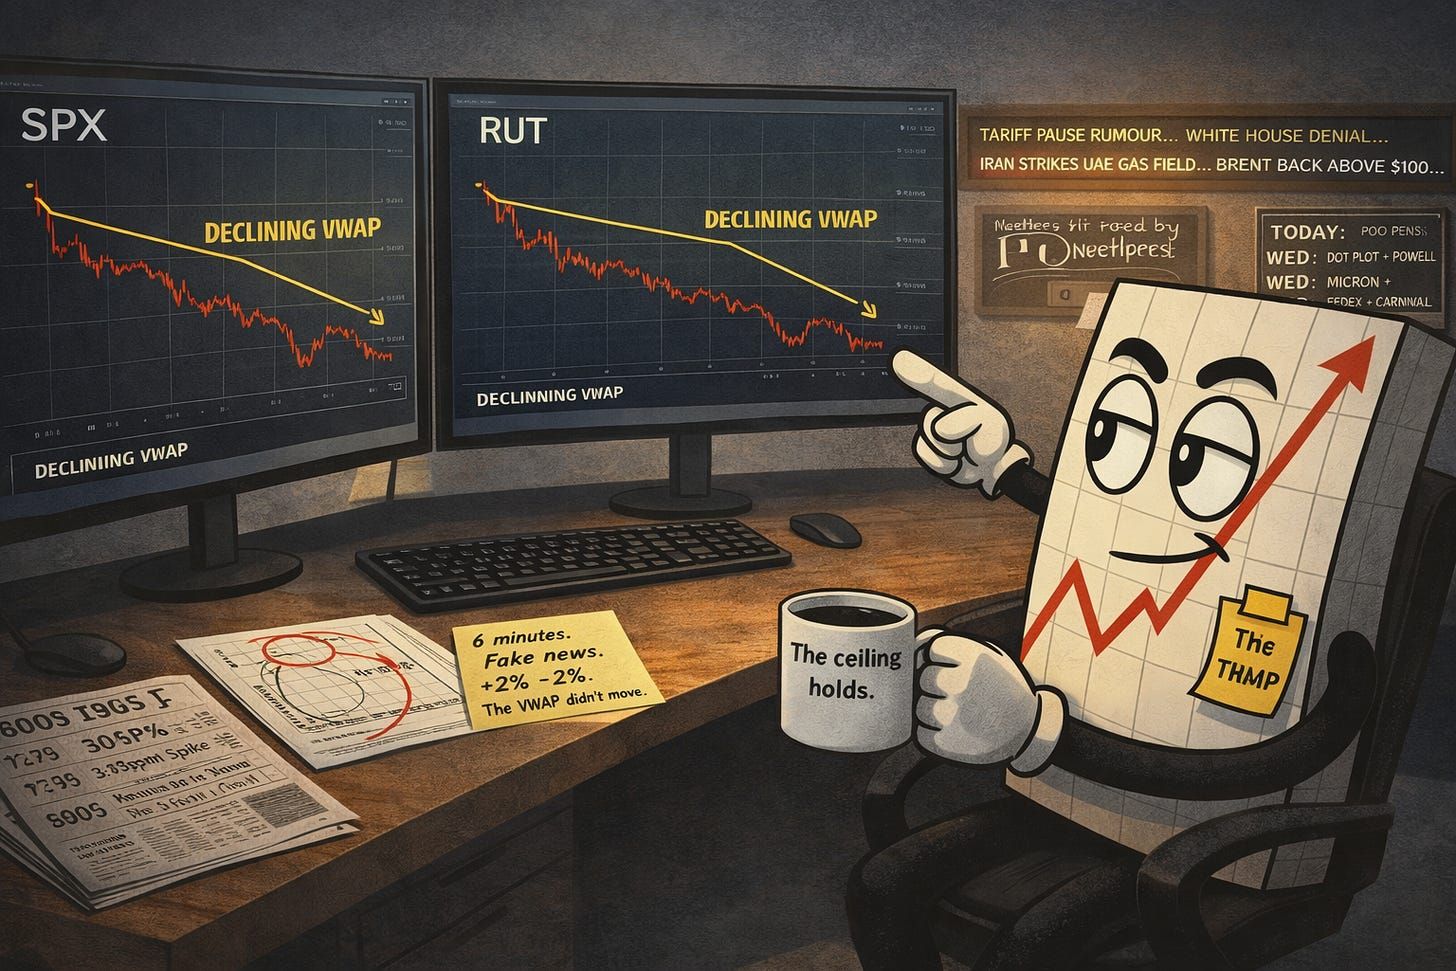
The declining VWAP is holding as a ceiling on both SPX and RUT – and it lines up neatly with the GEX levels. The 30-period BB setting continues to give the clearest read. Nothing from Monday’s session changed the signal.
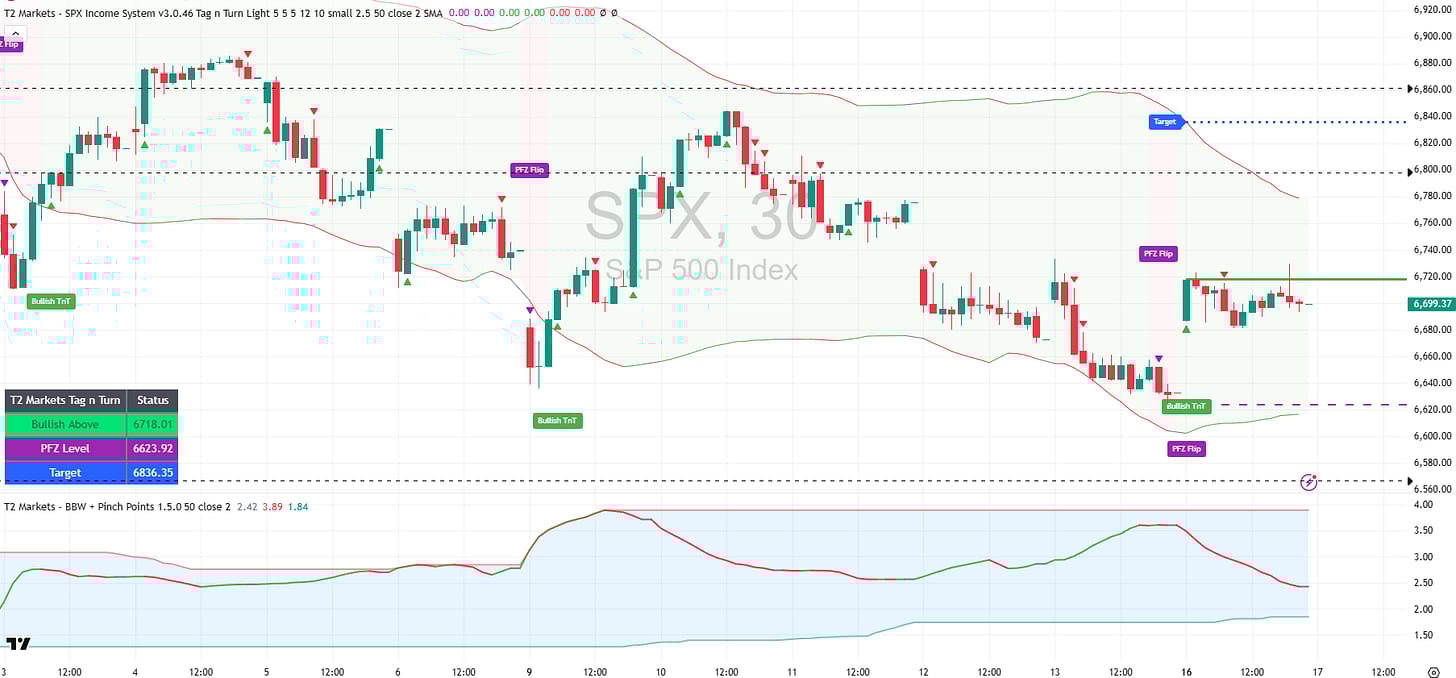
SPX Analysis
Bearish. The 30-period BBs have made this a lot clearer. The declining VWAP is the ceiling and it is doing its job.
The Bearish TnT remains in place. Price continues below the 6,796.09 trigger. The declining VWAP is holding firm as resistance and it lines up precisely with the 6,700 GEX level – two independent reads pointing at the same ceiling. Until price can get and hold above that zone with conviction the bear case stays intact.
Current Status: Bearish Below 6,796.09 / PFZ 6,845.08 / Target 6,613.64 / ATR 88.18 / declining VWAP + 6,700 GEX = ceiling
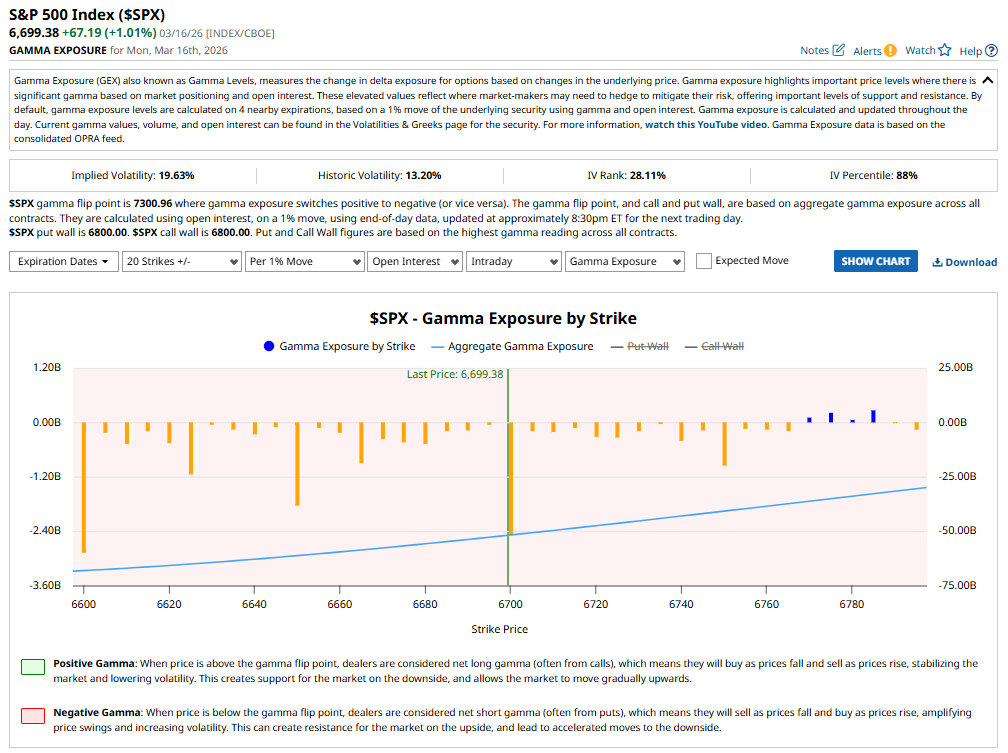
Gamma Exposure
GEX remains deeply negative. Put wall and call wall both at 6,800. Dealers still amplifying moves in both directions.
Gamma flip point at 7,300.96 – well above current price. Put and call wall both sitting at 6,800. Price at 6,699 is in the zone where dealer hedging works against mean reversion. The 6,700 level keeps appearing as the key reference – GEX, declining VWAP, and the TnT picture all agreeing on the same area. IV percentile at 88% – premium still elevated.
Current Status: Flip 7,300.96 / put wall + call wall 6,800 / 6,700 the convergence level / IV percentile 88%
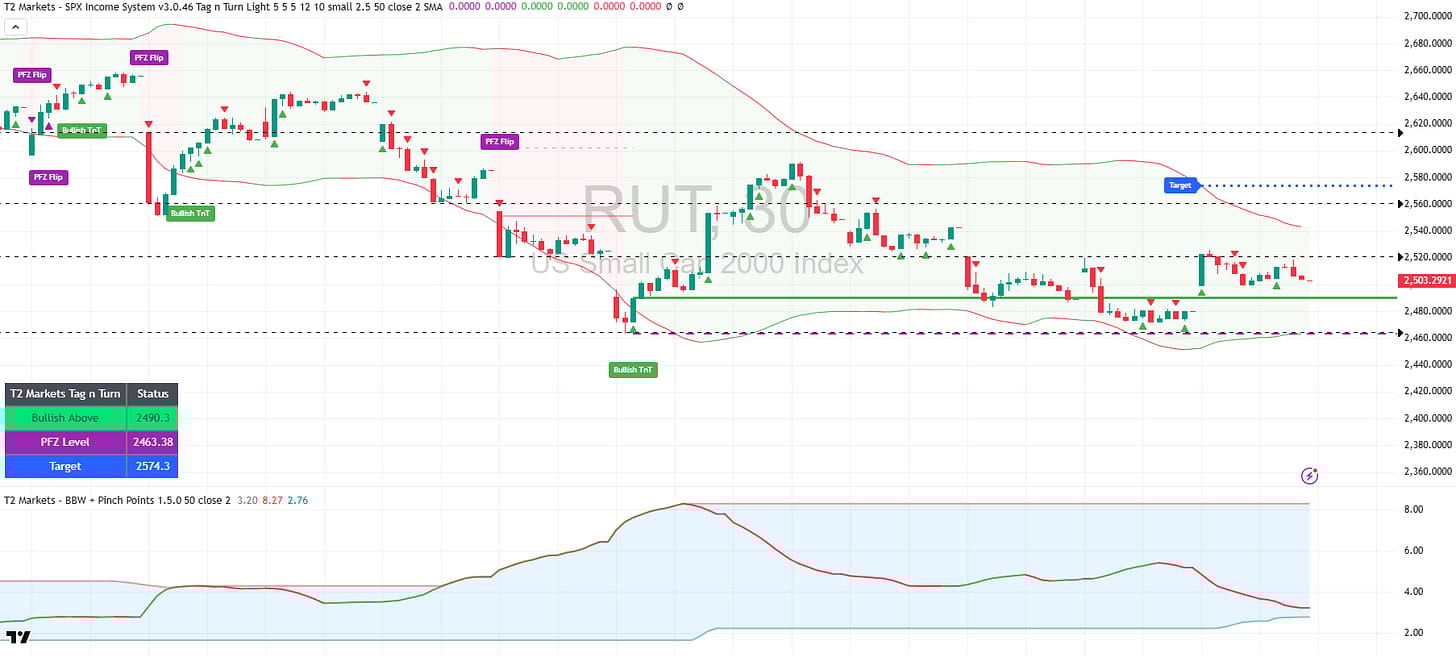
RUT Analysis
Uncle Russell fired a fresh bear setup and skipped the bull signal entirely. Declining VWAP holding as ceiling. Clear bear move.
The new Bearish TnT is in place at 2,508.15. What’s notable is that RUT bypassed the potential bullish read completely and went straight to a new bear setup – that tells you something about the conviction in the downward move. The declining VWAP is holding nicely as a ceiling here too. Target 2,462.87 remains the downside objective.
Current Status: Bearish Below 2,508.15 / PFZ 2,525.62 / Target 2,462.87 / skipped bull setup / declining VWAP ceiling holding
To Spike or Not to Spike – That Is the Question
With apologies to Shakespeare, who never had to trade through a fake tariff rumor.
“Whether ’tis nobler in the portfolio to suffer the slings and arrows of outrageous volatility, or to take arms against a sea of social media posts…”
Around 3:15pm EST on Monday, a social media post suggested that Trump was considering a 90-day pause on nearly all tariffs. Markets instantly spiked. All the algorithms, all the desks, all the momentum players – in within seconds. S&P up Just like that.
The White House issued a denial approximately as fast as the spike had formed. “Fake news.” Down went everything. The gains evaporated. Markets closed in the red before the late recovery found its footing.
The Dow ultimately closed up on the day – not because of the tariff rumor or the denial, but because of a broader base of optimism around oil prices retreating intraday. The spike and the crash were noise on top of a legitimate move that had already happened.
But here is the point. This is not new. The same pattern has played out multiple times since Operation Epic Fury began. A post – sometimes from a verified account, sometimes not – creates a move that takes seconds to form and seconds to reverse. The underlying is irrelevant. The tweet is the trigger.
The practical takeaway: In this environment, late session moves in either direction that arrive without a news wire confirmation deserve immediate skepticism. The speed of the move is the tell – a genuine fundamental shift does not move 2% in 30 seconds. A rumor does.
Rounding Off
Oil above $100 again. The Shah natural gas field strike in the UAE is a new escalation vector – not Hormuz, but a direct attack on Gulf energy infrastructure in a third country. Brent’s reload to above $100 after Monday’s retreat was immediate. Day 17 since Epic Fury began. Goldman’s revised inflation forecast is up 0.8 percentage points to 2.9%, GDP cut to 2.2%, recession odds at 25%. Oxford Economics says $120 Brent pushes eurozone, UK and Japan into contraction.
Earnings this week. Micron Wednesday after close – EPS $1.38+ expected, AI-driven DRAM demand is the focus, stock up 3.7% Monday in anticipation. FedEx Thursday – fuel cost commentary will be the read-through for the broader supply chain. Carnival Thursday premarket – tests cruise demand against $100 oil. Nvidia investor Q&A runs today at 9am PT.
Bitcoin and crypto. BTC broke $75K overnight with ETF spot inflows hitting $1.3 billion in March. ETH surged 8.32%, XRP +10%, the short squeeze cleared $540 million in positions. The war-hedge narrative is hardening. As noted in the BTC section above – momentum is showing divergence near Target 2. Worth watching rather than chasing.
Current Status: Brent above $100 / FOMC today + Wednesday / Micron earnings Wednesday / Goldman recession odds 25% / dot plot is the week’s real event
After Action Report – 16 Mar 2026 | Premium Popper | ORB20
7 trades yesterday –
5 Premium Poppers and 2 Lazy Poppers. The honest scorecard: 3 PP losses at -100% ROC, 2 PP wins at 60%+ish, and both Lazy Poppers paid at 90% ROC each. A rougher day on the Poppers – the losses were contained and defined, the Lazy trades did exactly what Lazy trades do. Full breakdown and debrief dropping later this week.
Current Status: 7 trades / 4 wins / 3 losses / full debrief and slides later this week
Expert Insights
“The four most dangerous words in investing are: ‘this time it’s different.’” — Sir John Templeton
The tariff pause rumor produced a 2% move in 30 seconds yesterday. Social media moved the market faster than any news wire. The White House denied it in approximately the same time. Markets recovered.
Templeton’s point applies in both directions. It is tempting to think that the current environment – oil wars, deleted tweets, fake tariff rumors – represents something categorically new that requires a categorically different approach. It does not. The market has always had noise. The noise has always created moves. Disciplined process has always been the answer.
What is genuinely different is the speed of the noise. Not its existence.
[Source: Sir John Templeton quote – widely attributed, public domain | Goldman Sachs revised forecasts – public, March 2026 | CME FedWatch – cmegroup.com]
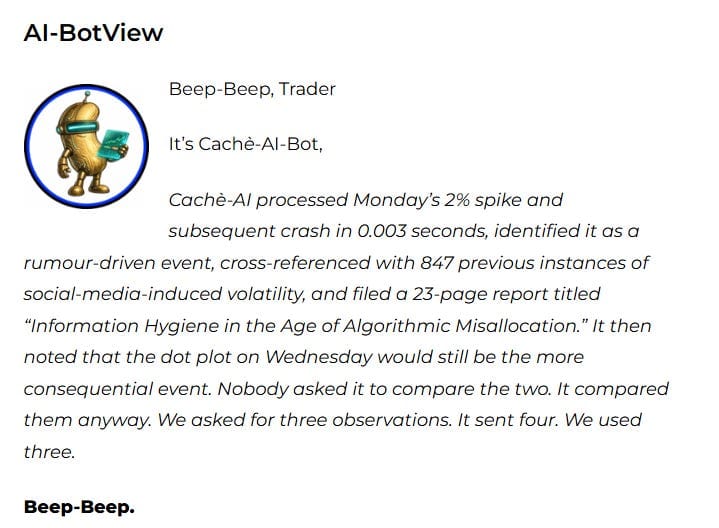
Beep-Beep.
1 – The Monday spike-and-crash pattern is algorithmically predictable and has been documented in academic literature since at least 2013. High-frequency trading systems are designed to react to price movement and keyword triggers rather than fundamental validity. [Source: SEC Flash Crash Review, public | Journal of Financial Economics, algorithmic trading and social media studies, public]. The 2% move in 30 seconds on a fake tariff post followed the same mechanics as the 2013 AP Twitter hack that briefly erased $130 billion in market value. The system has not changed. The tweets have just become more frequent.
2 – Iran striking the Shah natural gas field in the UAE represents an escalation from maritime disruption to direct energy infrastructure attack on a third country. The UAE is not a party to the conflict. [Source: Reuters geopolitical coverage, 16-17 March 2026, public]. This matters for the oil risk premium because it signals that the conflict’s geographic footprint is expanding beyond Hormuz. The IEA’s reserve releases were calibrated to address Hormuz supply disruption. They were not calibrated for a scenario in which Gulf infrastructure in multiple countries is under direct attack.
3 – Goldman Sachs raising 2026 US recession odds to 25% while simultaneously raising the inflation forecast is the textbook definition of a stagflation risk assessment. Goldman’s 2.9% inflation forecast with 2.2% GDP growth means the Fed is being asked to hold rates that are simultaneously too high for growth and too low for inflation. [Source: Goldman Sachs economic research, public, March 2026]. Wednesday’s dot plot is the moment the Fed formally acknowledges or denies this. Zero projected 2026 cuts is the acknowledgement. The bond market will move first.
Beep.
This Bot potentially hallucinates. Maybe. OK, Probably! It also filed a 23-page report nobody requested. Standard Tuesday.
In Other News…
Monday’s relief rally was based on a single observable fact: some tankers briefly moved through Hormuz over the weekend. Markets took this as evidence that perhaps everything was going to be fine. Oil dropped. All 11 sectors went green. The Dow put on 388 points. It was, for approximately 18 hours, a pleasant state of affairs.
Then Iran struck the Shah natural gas field in the UAE. The new Supreme Leader gave a statement. The word “certainly” was in it. Brent went back above $100. Tuesday morning futures are red. The pleasant state of affairs lasted until it didn’t.
Goldman Sachs raised its recession odds to 25% on Monday. This is the kind of number that usually commands headlines. This week it is the fourth most important development, behind the Hormuz closure, the UAE gas field strike, and whoever posts the next tariff rumor. Goldman’s analyst team is reportedly aware of their current standing in the news hierarchy and is taking it philosophically.
Bitcoin broke $75,000 overnight. ETH up 8.32%. XRP up nearly 10%. The short squeeze cleared $540 million in positions. At some point during a war, a gas field strike, and a fake tariff rumor, crypto quietly went to a multi-week high. The asset class specifically designed to be uncorrelated from geopolitical chaos is correlating with geopolitical chaos in the direction nobody expected. The gold bugs remain unavailable for comment.
Fun Fact:
The fastest market-moving event in recorded history was the 6 May 2010 “Flash Crash,” in which the Dow Jones dropped nearly 1,000 points – approximately 9% – in a matter of minutes before recovering almost as quickly. The event was eventually attributed to a combination of algorithmic trading, a large futures sell order, and cascading automated responses. The entire crash and recovery took approximately 36 minutes.
[Source: U.S. Securities and Exchange Commission and Commodity Futures Trading Commission joint report – “Findings Regarding the Market Events of May 6, 2010” – sec.gov]
Monday’s tariff rumor spike and denial took approximately six minutes. Technology has made us considerably more efficient at being wrong very quickly.
Trade well,
T2 Markets
p.s. Want full access to the SPX Income System (includes 7+ mechanical income strategies)? Join our team now!
p.p.s. Want funding to DAY TRADE our options strategies? Discover how you can start trading with up to $250k of RISK FREE capital!
Reply