- Option Income Project
- Posts
- Just When You Think You’re Out – The Bears Pull You Right Back In
Just When You Think You’re Out – The Bears Pull You Right Back In
SPX Market Briefing | 23 Jan 2026
T2 Markets
January 23, 2026
“Just when I thought I was out… they pull me back in!”
Read that in your best Al Pacino voice. Go on, I’ll wait.
Because that’s exactly what happened overnight. The bulls had their gap higher, their celebratory cigars lit, the champagne was chilling – and then the bears grabbed them by the lapels and dragged them right back into the family business.
What another fecking palaver.
Scroll down for the full breakdown
Including which index is spilling the beans on what comes next…

SPX Doesn’t Need You To Be Right. Just Consistent.
Pulse bar tells you when. Credit spreads handle the rest.
The Setup: Godfather Markets Edition
Here’s the thing about this week. We’ve had Trump doing his Jepetto routine – pulling strings, making indexes dance like Pinocchio after too much espresso. Tariffs on, tariffs off, Greenland threats, NATO tantrums, “I’ll start my own NATO with blackjack and hookers” energy.
But strip away the puppet master theatrics and ask yourself: what was actually developing before the weekend drama kicked off?
The bear.
That’s the narrative nobody’s talking about. The one that was quietly building whilst everyone was distracted by political theatre.
Multi-Market Status
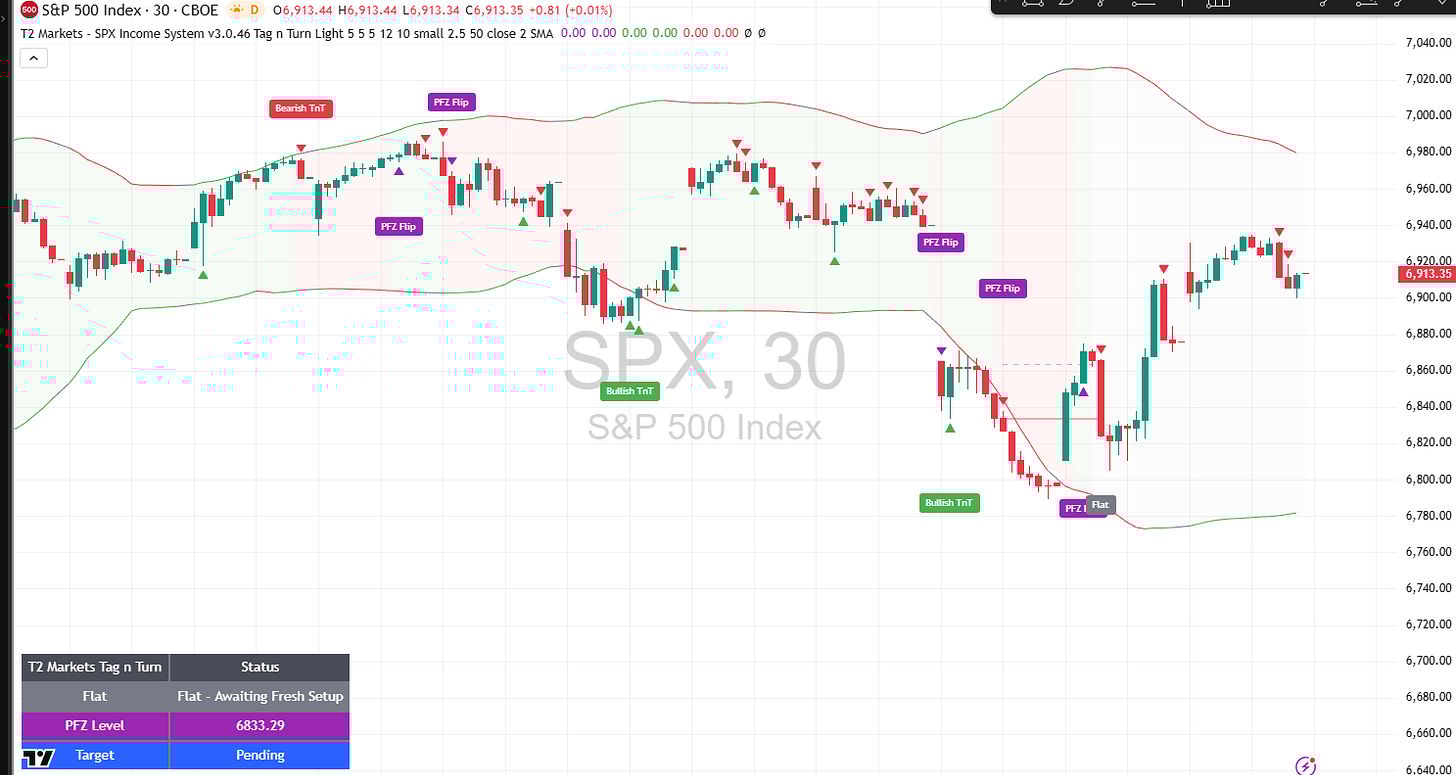
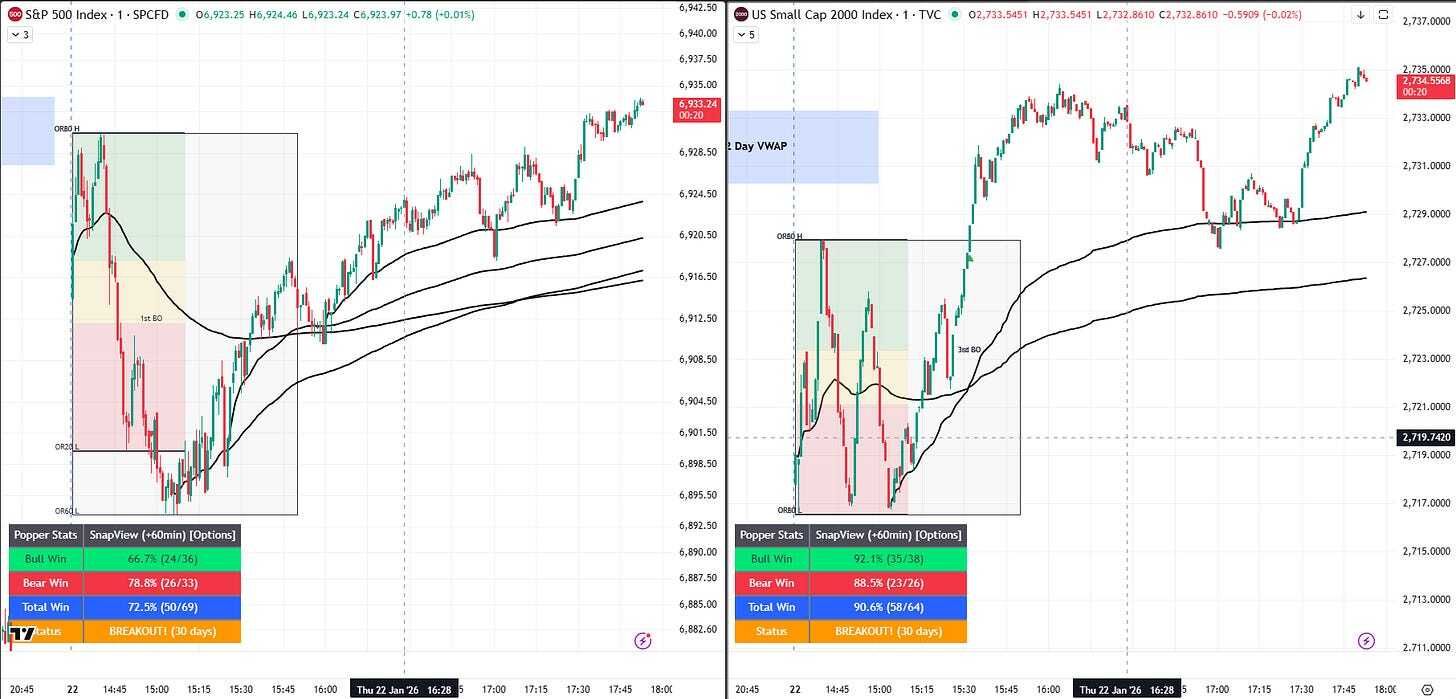
SPX: Flat – Awaiting Fresh Setup. The system officially flip-flopped into indecision. PFZ Level sitting at 6833.29. However – discretionary V-shaped conservative entry (6 Money Making Patterns) has me positioned bullish with a tight leash on the rising AVWAP.
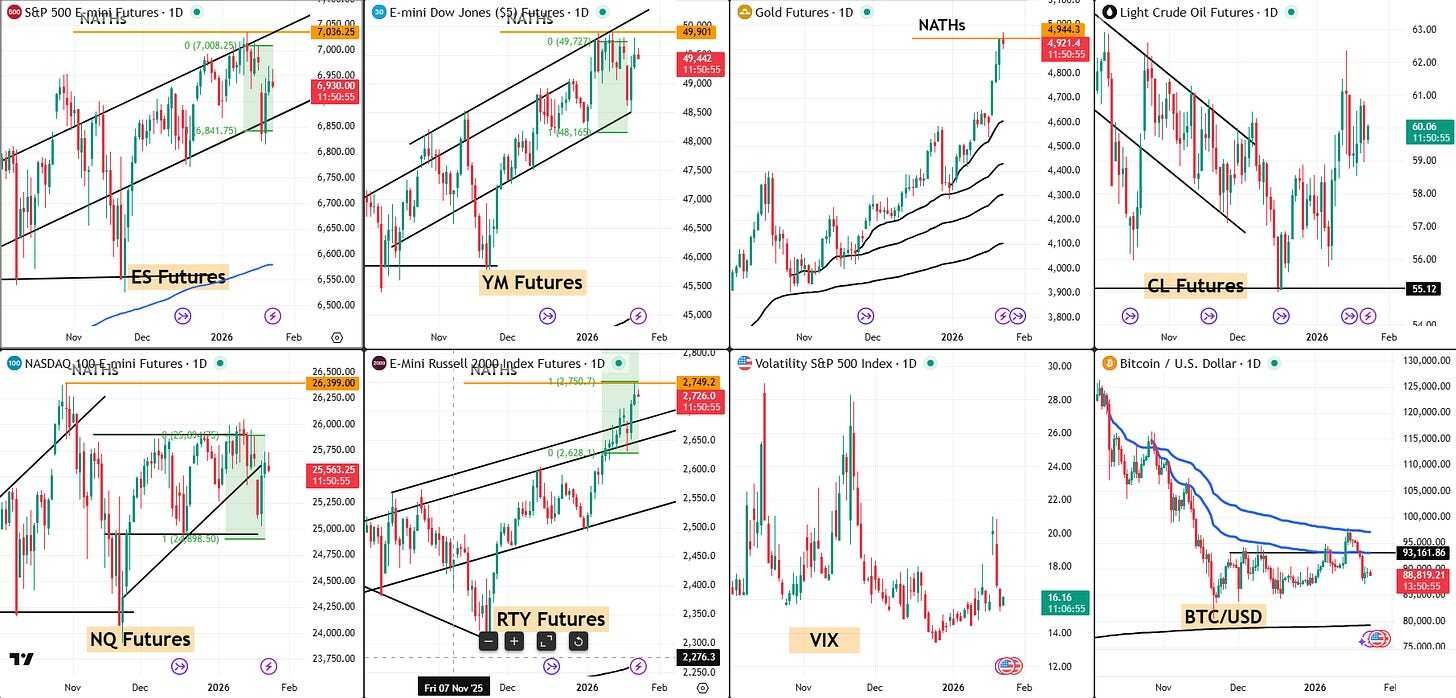
RUT (Uncle Russell): Bearish Below 2735.1. Target 2630.48. Tagged new all-time highs, immediately flipped bearish – because of course it did. The initial breakout target has been reached. A secondary target sits slightly higher, depending on how you draw that upper boundary (it was a bit vague). Either way – job done, hat tip, now what?
ES: Gap fill reaction territory from earlier in the week. Same story, different instrument.
NQ (Nasdaq): Gap filling right up to that rising trendline we drew after the bull reaction off horizontal support lows. This is the interesting one. Weakest of the lot. Hasn’t been participating in anything bullish. If we’re looking for a leading indicator on the bear move – this is your snitch.
YM (Dow): Similar gap fill pattern. Following the herd.
Gold: Rampaging to safety highs. $4,966/oz. Best week since March 2020. Up 12% in January alone. Greenland uncertainty plus weaker dollar equals safe haven flows.
Bitcoin: Hibernating at $89K whilst Fear Index hits 20 (extreme fear). Yet whales accumulate. January ETF flows net near zero. Make of that what you will.
The Real Story
Forget Trump for a second.
Look at the price action without the political noise filter:
The futures turned overnight. Having already turned intraday. The indexes are reacting off their gap down levels from earlier in the week. RTY hit its target and immediately reversed. Nasdaq – the weakest player who’s been leading absolutely nothing bullish – is now gap filling right into resistance.
This is starting to look less like “Trump chaos” and more like “bear narrative that got interrupted by a weekend news cycle.”
Systematic Position Management
Given all the above, here’s the actual trade management happening:
The V-shaped conservative entry from the 6 Money Making Patterns got me bullish before the system officially decided what it wanted to do. Not coded up yet to find these automatically – that’s on the to-do list.
This creates discretionary flexibility within the systematic framework. We’re slightly off-piste here, but not lost in the wilderness.
The rising anchored VWAP becomes the leash. Price respects it? Bull swing stays on. Price violates it? Cull the position and pivot.
Hedge Status: Already took a small hedge yesterday to essentially lock in a small profit should there have been a large gap down today. Smart? We’ll see. But the overnight move down means I can cull the bull and cash in on the hedge for a gain if needed.
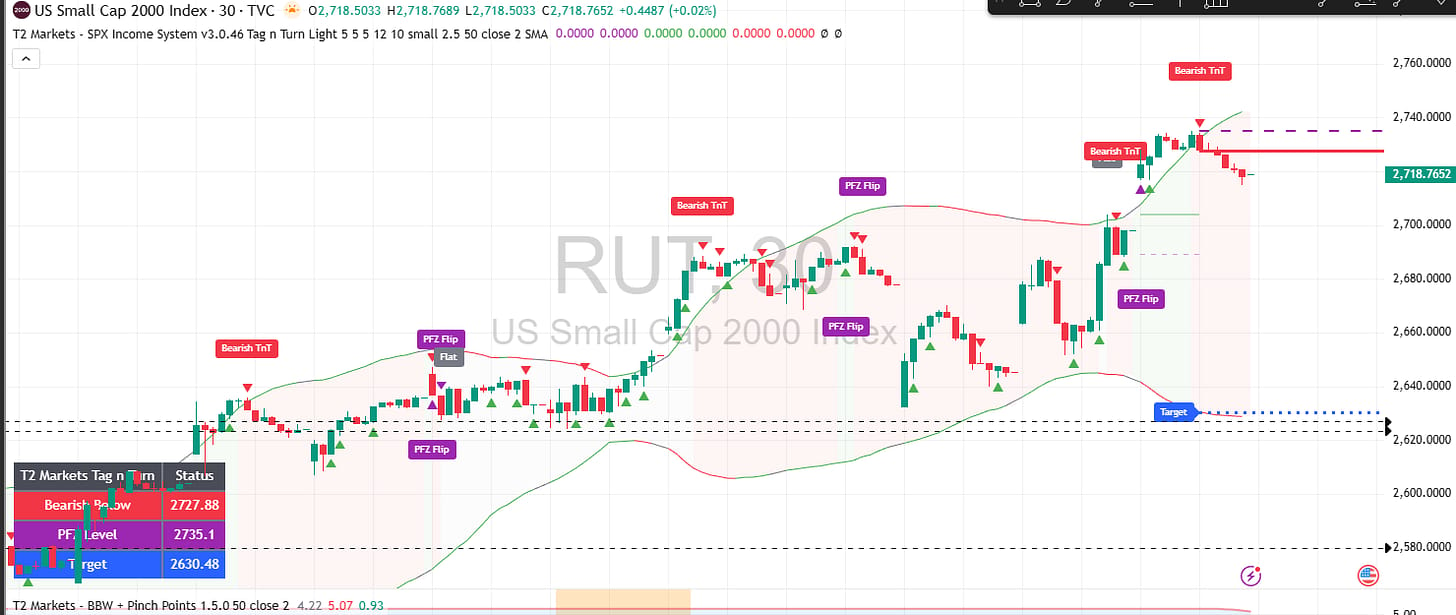
RUT: Classic 1st breakout PopPop. Textbook stuff.
SPX: Had a bit of fun with VWAP and popped a popper on.
Profits Pop Pop indeed.
News That Actually Matters (Maybe)
Intel’s Earnings Paradox: Beat $0.15 EPS versus $0.08 expected. Revenue $13.7B beat. Market reaction? Down 12% because Q1 guidance landed at $11.7B-$12.7B versus $12.51B consensus. Supply constraints blamed. Stock went from $47 to $41 faster than you can say “forward guidance matters more than actuals.”
TikTok Saga Finally Ends: Five years of drama culminating in Oracle, Silver Lake, and MGX each taking 15% stakes. ByteDance kept 19.9%. Trump personally thanked Xi. 200 million US users can finally exhale. Algorithm retraining begins.
PCE Stuck at 2.8%: Both November headline and core above Fed’s 2% target. January rate hold now 95% probability. Strong spending meets stubborn inflation. Policy stalemate through first half expected.
Expert Insights
The Gap Fill Phenomenon
When multiple indexes simultaneously fill gaps from earlier sessions, it often signals a test of prior support/resistance levels rather than a directional commitment. In essence, markets are “checking their work” before the next sustained move.
The Nasdaq’s behavior deserves particular attention here – when the weakest index in an up-move leads the way on any retracement, it often acts as the canary in the coal mine for broader directional shifts.
Systematic traders watch the laggard, not the leader.
[Source: Market structure principle – observable across multiple instruments today]
Fun Fact:
Gold’s January Performance in Historical Context
Gold is up 12% in January 2026, marking its best start to a year since 2008. That year, gold ultimately gained 5.5% by December despite the financial crisis volatility. The current surge is driven by Greenland geopolitical uncertainty, a weakening dollar, and investors seeking safety ahead of uncertain Fed policy.
Meanwhile, Bitcoin’s Fear & Greed Index hitting 20 (extreme fear) whilst simultaneously seeing whale accumulation mirrors patterns seen in late 2022 before major recovery moves.
The divergence between traditional and digital safe havens hasn’t been this pronounced since March 2020.
[Source: Historical gold performance data – Stock Trader’s Almanac / Crypto Fear & Greed Index – Alternative.me]
++++++
Trade well,
T2 Markets
p.s. Want full access to the SPX Income System (includes 7+ mechanical income strategies)? Join our team now!
p.p.s. Want funding to DAY TRADE our options strategies? Discover how you can start trading with up to $250k of RISK FREE capital!
Reply