- Option Income Project
- Posts
- Gold’s a Rocket Ship. Meta Bets $135B. Markets Can’t Get Any Weirder. | SPX Market Briefing | 29 Jan 2026
Gold’s a Rocket Ship. Meta Bets $135B. Markets Can’t Get Any Weirder. | SPX Market Briefing | 29 Jan 2026
S&P Touches 7,000. Closes Flat. That’s January 2026 in One Sentence.
T2 Markets
January 29, 2026
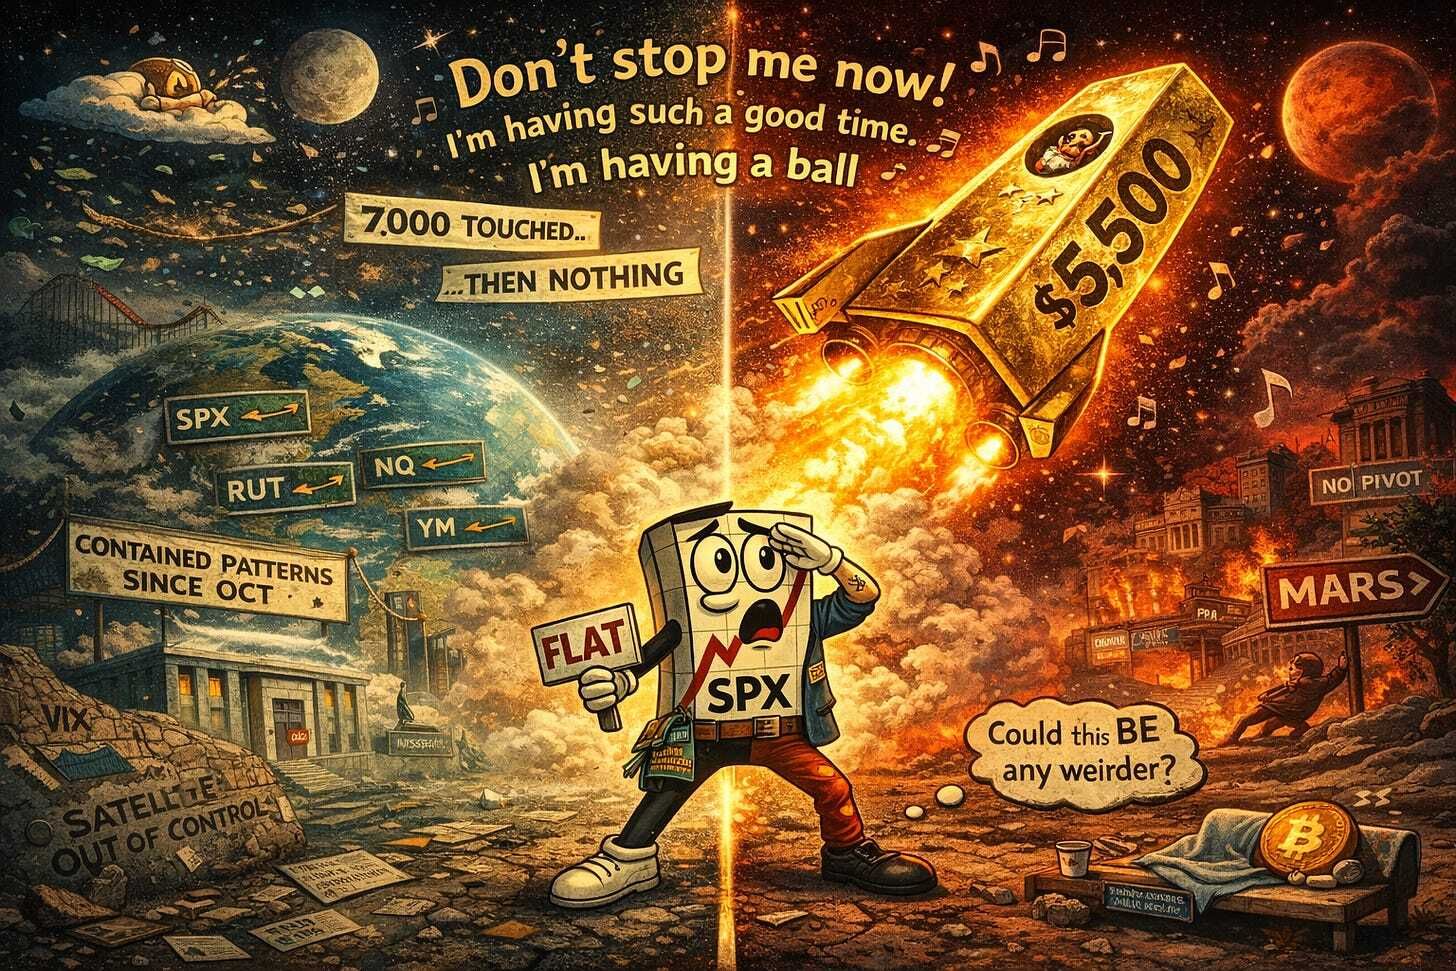
“I’m a rocket ship on my way to Mars, on a collision course…”
That’s gold right now. $5,500 and climbing. Like a satellite out of control. Like Lady Godiva.
I’m sure Queen won’t mind me borrowing a few lyrics because honestly, nothing else captures this gold chart quite as well.
Meanwhile, the S&P 500 touched 7,000 for the first time in history yesterday. Then closed flat at 6,978. Because of course it did.
“Could these markets be any weirder?”
Chandler voice
Meta just announced they’re spending $135 billion on “superintelligence.” Microsoft dropped 7% because Azure only grew 39%. SAP crashed 14% because their CFO admitted AI might let customers “do everything themselves.”
And somewhere in the background, we’re all just waiting for someone at the Fed to start shouting
“PIVOT! PIVOT! PIVOT!”
…like Ross moving a couch.
Same patterns. Same ranges. Same chaos. Let’s trade it.
Scroll down for the systematic breakdown – including why Fed Day produced 3 wins for premium sellers…
SPX. 30 Minutes. One Trade. Job Done.
Trade less. Profit more. This isn’t trading… it’s income engineering.
Market Briefing:
Multi-Market Status
SPX: Flat – Awaiting Fresh Setup. PFZ Level 6833.29. Target pending. But here’s the thing – price is unofficially bearish. Back at the range boundary with a V-shaped entry presenting itself. Same setup, opposite direction from the discretionary bullish play. Target is range lows. One of the 6 Money Making Patterns in action.
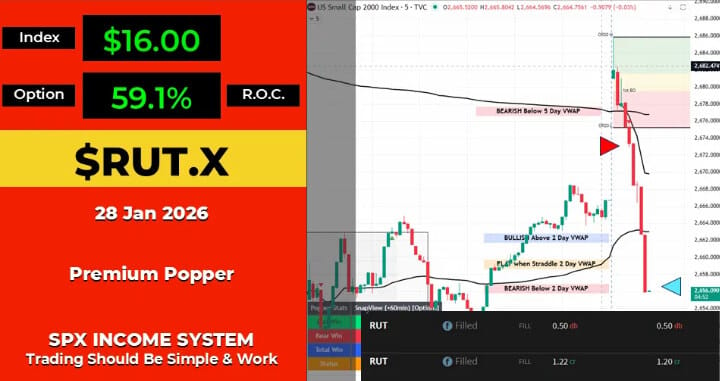
RUT: Bearish Below 2727.88. PFZ Level 2735.1. Target 2631.95. Still bearish. Still grinding. And for fun, I’ve spotted a head and shoulders pattern forming right at the NATH and range high. If the neckline breaks, we could finally see price push back into the range properly. Or it flips and flops. Month end approaching – we get paid either way.
ES Futures: 7,015 – touched 7,043 yesterday before retreating. The 7,000 party was short-lived.
NQ Futures: 26,197.50 – Meta’s 10% surge offset Microsoft’s 7% drop. Net result: basically flat.
YM Futures: 49,166 – recovering from the healthcare massacre, now dealing with Microsoft drag.
RTY Futures: 2,667.2 – grinding towards target. Head and shoulders pattern developing.
Gold: $5,525 – ROCKET SHIP MODE. Don’t stop it now. It’s having such a good time.
VIX: 16.72 – popped on Fed Day, immediately crashed back. Blue smarties and metaphoric couches.
Bitcoin: $87,900 – still stuck at $88K whilst gold parties. The “digital gold” narrative looking increasingly awkward.

The Contained Pattern Reality
Here’s what’s actually been happening since October:
The indexes have been trading in well-defined patterns. Rising channels. Consolidation ranges. Support and resistance levels that keep getting respected.
All the headlines about 7,000 and new highs? That’s noise. The structure hasn’t changed. Price touches the upper boundary, pulls back. Touches the lower boundary, bounces. Rinse and repeat.
Yesterday was the perfect example. S&P touched 7,000 – the upper boundary of this entire move – and immediately retreated. Closed flat. The pattern holds.
What changes things: A decisive break above with follow-through. Or a decisive break below. Until then? Same ranges. Same setups. Same opportunities.
The SPX Bearish Setup
Let’s talk about what’s developing on SPX:
Price is back at the range boundary – the upper edge of this consolidation we’ve been tracking. The V-shaped entry that worked for the discretionary bullish swing? Same pattern, opposite direction.
The Setup:
Price at upper range boundary
V-shaped entry presenting
Target: range lows (around 6873 area marked on chart)
This is one of the 6 Money Making Patterns – sell the rally at range resistance
We’re officially flat on the TnT system, awaiting fresh setup. But the discretionary read says bearish at these levels makes sense. The same pattern recognition that caught the bounce now suggests the fade.

The RUT Head and Shoulders
Something interesting forming on Russell:
Right at the NATH and range high, there’s a pattern that looks suspiciously like a head and shoulders. Left shoulder, head at the absolute peak, right shoulder forming now.
What it could mean:
If neckline breaks, classic H&S target takes price well into the range
Confirms the bearish TnT signal we’ve been riding
Finally gives RUT the catalyst to push back into its larger consolidation
Or:
It flips and flops like everything else this month
Month end sees prices pause before moving
Either way – the bearish swing is positioned, target at 2631.95. We get paid on direction or time decay. The pattern is just context.

Three trades yesterday. All winners. On Fed Day.
Trade 1 – RUT ORB20: Bear break off the 5-day VWAP. $16 index move. 59.1% ROC.
Trade 2 – SPX ORB20: Bear break off the new all-time high. $10 index move. 62.9% ROC.
Trade 3 – RUT VWAP Retest: Meandered sideways. $2 index move. 58.3% ROC. Profits from time decay, not direction.
The lesson: “What about FOMC?”
Make a decision. Trade them or don’t trade them. It makes little difference to premium sellers.
We’re not betting on what Powell says. We’re not predicting the market’s reaction. We’re selling premium into elevated volatility and letting theta do the work.
Trade 3 is the perfect example – price went sideways during FOMC nonsense, and we still collected 58% ROC from time decay alone.
Popper Stats (30-day rolling):
Bull Win: 86.1% (31/36)
Bear Win: 96% (24/25)
Total Win: 90.2% (55/61)


The Big Tech Divergence
Yesterday’s earnings told three very different stories:
Meta (+10%): Revenue $59.9B (+24%). EPS $8.88. Then the bombshell – 2026 capex guidance of $115-135 billion for “superintelligence” infrastructure. Zuckerberg’s biggest AI bet ever. Market loved it.
Microsoft (-7%): Beat revenue ($81.3B). But Azure grew “only” 39%. Below whispers. Capex hit record $37.5B. Market hated it. Cloud deceleration spooks everyone questioning AI payoff timelines.
Tesla (+2%): Quietly beat. EPS 50c vs 45c expected. Revenue fell 3% but robotaxi progress and $2B xAI investment lifted spirits.
SAP (-14%): The nightmare scenario. Cloud backlog grew 16% vs 26% expected. CFO warned AI could let customers “do everything themselves.” Enterprise software existential crisis in real time.
Tonight: Apple reports. The last of the mega-caps. Then shutdown deadline Friday midnight.
Expert Insights
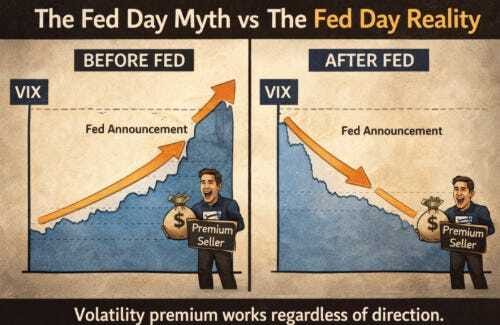
The Fed Day Trading Myth
Conventional wisdom says avoid trading on Fed days – too much uncertainty, too much volatility, too much risk of getting whipsawed by Powell’s comments.
The data tells a different story for premium sellers.
VIX typically elevates into Fed decisions, pricing in uncertainty. This elevated IV means richer premiums. When the decision lands (usually as expected – holds are boring), IV often crushes regardless of direction.
Premium sellers profit from this IV crush. Whether price goes up, down, or sideways, the volatility premium deflates post-announcement.
Yesterday’s three trades demonstrated this perfectly. Directional bets could have been whipsawed. Premium collection worked regardless of Powell’s word choices.
[Source: Options pricing dynamics around FOMC announcements]
Fun Fact:
Meta’s $135B AI Bet in Context
Meta’s 2026 capex guidance of $115-135 billion represents the largest single-year infrastructure investment commitment in technology history. For context:
It exceeds the entire GDP of over 100 countries
It’s more than the combined 2025 capex of Microsoft ($37.5B), Google ($32B), and Amazon ($30B)
It’s roughly equivalent to NASA’s entire budget for three years
Zuckerberg called it an investment in “superintelligence” – marking the first time a major tech CEO has publicly used that term in earnings guidance.
Whether this becomes the greatest investment of the AI era or the most expensive white elephant in corporate history won’t be known for years. But the scale is unprecedented.
[Source: Company earnings reports, government budget data]
Trade well,
T2 Markets
p.s. Want full access to the SPX Income System (includes 7+ mechanical income strategies)? Join our team now!
p.p.s. Want funding to DAY TRADE our options strategies? Discover how you can start trading with up to $250k of RISK FREE capital!
Reply