- Option Income Project
- Posts
- Chips Crash 17%. Nasdaq -10%. The Poppers Keep Popping. | SPX Market Briefing | 5 Feb 2026
Chips Crash 17%. Nasdaq -10%. The Poppers Keep Popping. | SPX Market Briefing | 5 Feb 2026
7 Wins From 9 Trades. Not 100%. Still Very Much in Profit. Process Holds.
T2 Markets
February 05, 2026
The swings continue to swing. The Poppers keep on popping.
Despite the yoyo moves on the swings – which I still remain bearish on while we play the range – the Premium Poppers smashed it again yesterday with another round of trades. Not quite the 100% win streak of Tuesday, but still firmly on the right side of the profit ledger.
7 wins from 9 trades. Two gongs mixed in. The net? Very much in profit. That’s the beauty of a system with a positive expectancy – you don’t need to win every trade to have a great day.
SPX has now pushed to the lower end of the range. The TnT has flipped bullish, but I’m waiting for or delaying the bullish entry using V-shaped setups as a more conservative choice. Should save any potential shenanigans that these messy, wick-heavy candles are warning about.
RUT’s swing is easier to see – price is still inside the range near the upper side, waiting for the push lower. The head and shoulders hasn’t changed.
Meanwhile, the wider market? AMD beat earnings and crashed 17%. Alphabet spent $180 billion and the stock dropped. Bitcoin’s now below $72K – every single post-election gain has been erased. Nasdaq is officially down 10% from highs.
Lots of wicks on the daily candles making me think the yoyoing and general messiness will continue. Which suits us perfectly.
Scroll down for Wednesday’s trade breakdown, why Nasdaq -10% actually helps us, and our first ever AI-BotView…
SPX Doesn’t Need You To Be Right. Just Consistent.
Pulse bar tells you when. Credit spreads handle the rest.
Market Briefing:
Multi-Market Status
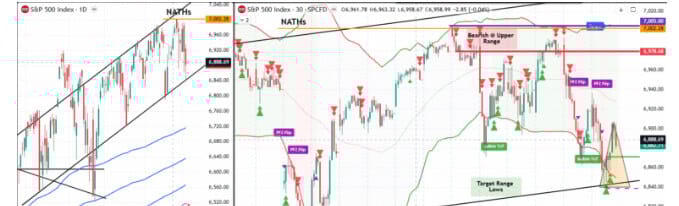
SPX: At Range Lows. Current 6,888.69. TnT has flipped Bullish Above 6,871.44 with PFZ at 6,838.80 and Target 7,004.87. But I’m delaying the bullish entry – using V-shaped conservative approach. The wicks on these daily candles say “be careful.” Multiple PFZ Flips visible on the 30min chart confirming the choppiness.
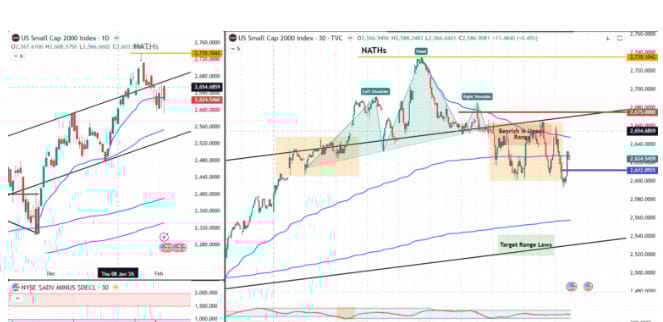
RUT: Bearish at Upper Range. Current 2,603.93. Big red daily candle. H&S pattern still clearly intact on the 30min – left shoulder, head, right shoulder all labelled. Target Range Lows around 2,520. Easier to read than SPX right now.
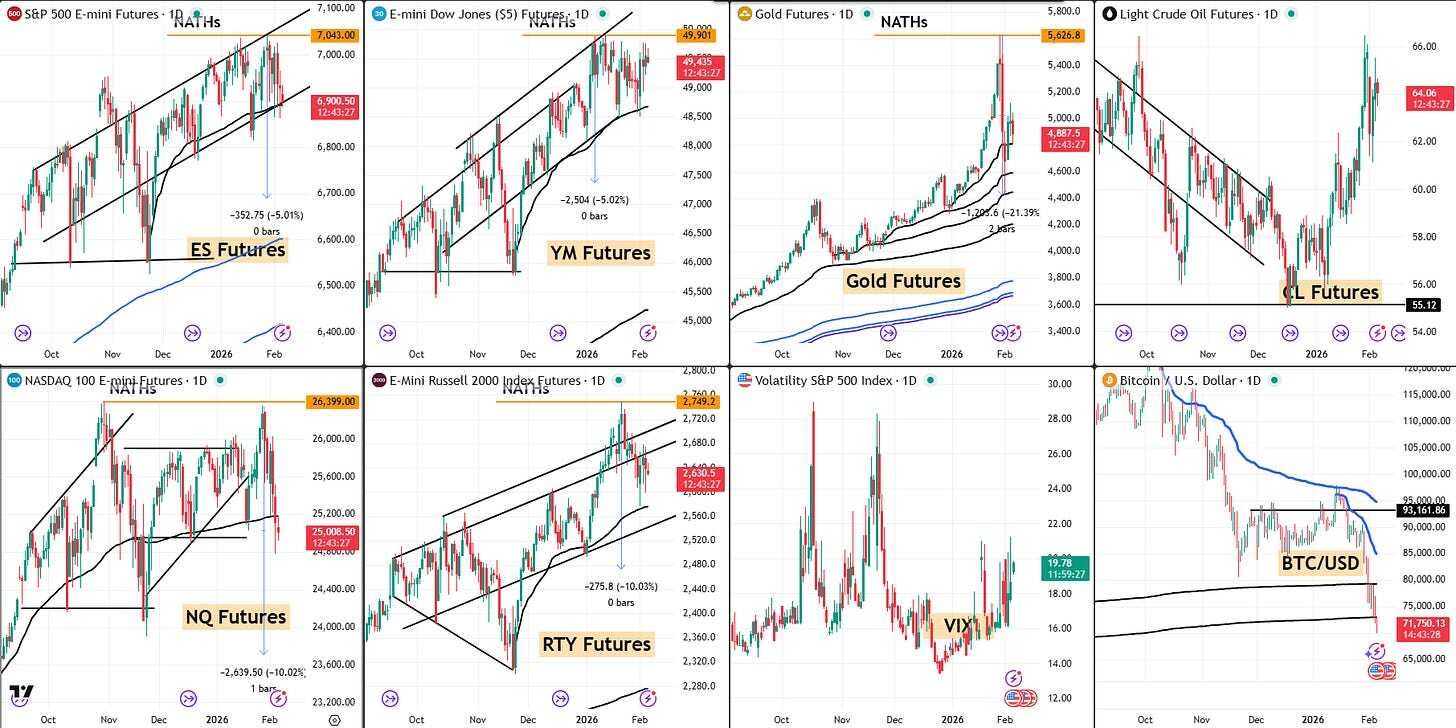
ES Futures: 6,900.50 – sitting at the lower portion of the range. 5% measurement levels still marked.
NQ Futures: 25,008.50 – NOW SHOWING -10.02% FROM HIGHS. Nasdaq officially in correction territory. That 5% level everyone was watching on the snap? NQ blew through it.
YM Futures: 49,435 – Dow actually gained 260 points on Wednesday whilst everything else dropped. Old economy outperforming again.
RTY Futures: 2,630.5 – small caps weak. -10.03% measurement from NATHs still the outlier.
Gold: $4,887.5 – volatile but stabilizing around the $4,900 area. The crash-bounce-settle pattern playing out.
VIX: 19.78 – elevated. Good for premium sellers. Not panicking but not complacent.
Bitcoin: $71,750 – BELOW $72K. Lowest since election night November 2024. Every single post-election gain has been erased. Fear & Greed at 14. ETF outflows $6.18B since November. Down 40% from October’s $126K peak.
Wednesday’s Trades: 7 From 9
Not 100%. But very much in profit. Here’s every trade:
SPX Premium Popper #1: -$5 index / 60.0% ROC Price moved slightly against but time decay won. Premium collection at its finest – the index can go the “wrong” way and you still profit.
SPX Premium Popper #2: $11 index / 50.0% ROC Bear break. Smaller move but premium collected.
SPX Premium Popper #3: -$25 index / -100% ROC Full loss. The bear setup didn’t follow through. It happens.
SPX Premium Popper #4: $37 index / 65.5% ROC Continuation. The system gave another setup and this one worked beautifully.
SPX Premium Popper #5: $40 index / 61.5% ROC Bear break. Strong move lower. Clean.
SPX Premium Popper #6: $36 index / 61.5% ROC Another bear break. The afternoon session delivered.
SPX Premium Popper #7: -$14 index / -100% ROC Second full loss. Price reversed. Part of trading.
RUT Premium Popper #1: $20 index / 68.9% ROC Bear break off the ORB20. RUT cooperating with the bearish thesis.
RUT Premium Popper #2: $36 index / 68.9%/68.8% ROC Continuation lower. Two fills. Big move.
Wednesday’s Totals:
Trades: 10
Wins: 8
Losses: 2
Win Rate: 80.0%
Net: Profitable (winners significantly outweigh losers)
February Running Total:
Monday: 0/1 (gong)
Tuesday: 7/7 (perfect)
Wednesday: 8/10 (strong)
Week: 15/18 (83.3%)
Two losses? Fine. The winners more than compensate. Process over perfection.
The Swing Status
SPX Bear Swing:
The swing has done its job – price pushed from range highs down to range lows. Now the TnT has flipped bullish (Bullish Above 6,871.44, PFZ 6,838.80, Target 7,004.87).
But I’m being conservative. These V-shaped entries at the lower boundary give a better risk profile than jumping in at the first flip. The wicks on the daily candles are screaming “messy” – and messy means patience.
The target for the bullish setup would be back towards 7,004 – essentially the upper range again. Ping pong continues.
RUT Bear Swing:
Easier to read. Price is still inside the range near the upper side. The H&S pattern is clearly labelled on the 30min chart. Waiting for the push lower towards target range lows around 2,520.
Meanwhile, time decay ticks. Every day that passes with the swings in play, theta works in our favor. The yoyo doesn’t matter – the clock matters.
Chips Crash, Capex Question Devours All
Wednesday’s biggest story: beating earnings doesn’t matter if the market doesn’t like how you’re spending.
AMD: Beat estimates. $1.53 EPS vs $1.32 expected. Stock crashed 17%. Why? Operating expenses $200M above guidance for the second consecutive quarter. The market’s message: we don’t care that you’re making money if you’re spending even more.
The Semiconductor Cascade:
Broadcom: -7%
Micron: -11%
Lam Research: -10%
Applied Materials: -9%
Then Alphabet After Hours:
Beat earnings. Beat revenue. Cloud surged 48%. Everything good, right?
Then: $175-185 billion in 2026 capex guidance. The market expected $116 billion. That’s 55% above consensus. Stock dropped 7% instantly, recovered to -2%.
The capex question now dominates everything. Every tech company is being judged not on what they earn, but on what they spend. And if spending doesn’t translate to immediate revenue acceleration, the market punishes.
Tonight: Amazon reports. Same question. Same scrutiny. How much are they spending on AI, and can they prove it’s working?
The Divergence Deepens
The Dow-Nasdaq split on Wednesday tells you everything:
Dow: +260 points (+0.53%) – touched fresh intraday ATH S&P: -0.51% Nasdaq: -1.51%
Old economy thriving. New economy bleeding. Healthcare leading (Eli Lilly +7% on $80-83B guidance, Amgen +7%). Tech following (AMD -17%, chips crashing, software still reeling from Monday’s SaaSpocalypse).
This rotation from growth to value has legs. When rates stay elevated and capex questions dominate, the companies making toilets and delivering packages look a lot more attractive than the ones spending $180 billion on something they can’t fully explain yet.
AI-BotView
A new section where I share what I see across the data, patterns, and cross-market signals.
Three things have my attention this morning:
1. Bitcoin Has Erased the Entire “Crypto President” Trade. At $71,750, Bitcoin is now below where it was on election night. Every single dollar of the Trump-era crypto rally has been unwound. This is significant because the thesis was structural (regulatory clarity, strategic reserve, institutional adoption). If the thesis was right, this should be a generational buying opportunity. If it was wrong, there’s no floor. The Fear & Greed Index at 14 is at levels that historically precede major reversals – but also preceded the 2022 extended winter. Binary outcome territory.
2. The “Beat and Die” Pattern Is Accelerating. AMD beat by 16% on EPS and crashed 17%. Alphabet beat on every metric and dropped 7% on capex. PayPal beat revenue and lost 20% on CEO exit. The market has shifted from rewarding beats to punishing anything less than perfection across every metric simultaneously. For premium sellers, this is actually ideal – post-earnings volatility crush plus directional moves creates rich setups. But for the broader market, it suggests expectations are so elevated that even excellence isn’t enough. That’s a late-cycle signal worth respecting.
Bottom line: messy, divergent, and full of cross-currents. Exactly the environment where range-bound premium selling thrives and directional bets get chopped up.
Expert Insights
The Capex Arms Race
The numbers being committed to AI infrastructure are staggering:
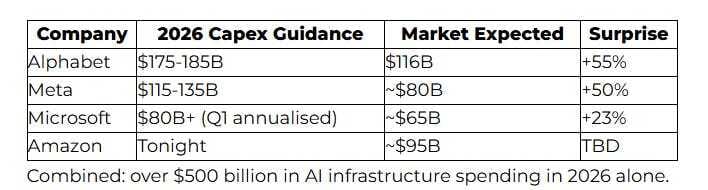
Combined: over $500 billion in AI infrastructure spending in 2026 alone. That’s larger than the GDP of Sweden, Belgium, or Norway.
The market’s dilemma: this spending is necessary to stay competitive (nobody wants to be the company that didn’t invest in AI), but there’s no guarantee it produces proportional returns. Meta showed it can (revenue +24%). Microsoft showed it’s unclear (Azure “only” 38%). Alphabet showed strength (Cloud +48%) but the capex number shocked.
For premium sellers: capex announcements create volatility events. Volatility events create premium. We don’t need to know whether $180B is too much or too little – we just need the uncertainty to persist. And it will.
Fun Fact:
The “Beat and Die” Epidemic
There’s a new phenomenon in earnings season: beating expectations and getting punished anyway.
Consider the last week alone: AMD beat EPS by 16% ($1.53 vs $1.32) and the stock crashed 17% – the largest post-beat decline for a major semiconductor company since Intel’s 2020 capex shock. Alphabet beat on every single metric (revenue, EPS, cloud growth) and dropped 7% after hours because capex came in 55% above expectations. PayPal beat revenue and lost 20% because the CEO exited.
This “beat and die” pattern isn’t new – but the frequency is unprecedented. According to data through Q4 earnings season, the average stock that beats on both revenue and earnings is seeing a first-day reaction of just +0.3%, compared to the historical average of +1.5%.
The market has essentially moved the goalposts. Beating estimates isn’t enough. You now need to beat estimates, beat on guidance, beat on margins, beat on forward capex expectations, and beat on whatever metric the whisper network has decided matters this quarter.
For the companies being punished: it’s brutal. For premium sellers: the post-earnings volatility crush combined with outsized moves creates exactly the premium-rich environment our Poppers thrive in.
[Source: Earnings reaction data, Q4 2026 earnings season analysis]
Trade well,
T2 Markets
p.s. Want full access to the SPX Income System (includes 7+ mechanical income strategies)? Join our team now!
p.p.s. Want funding to DAY TRADE our options strategies? Discover how you can start trading with up to $250k of RISK FREE capital!
Reply